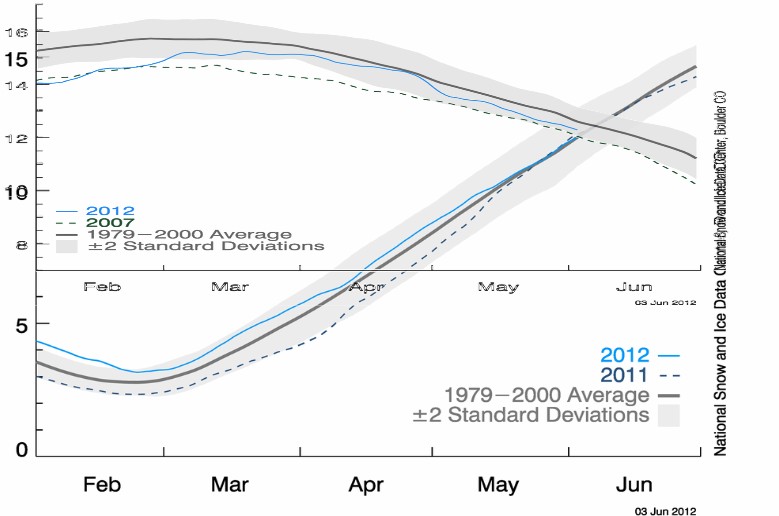
North and South Polar ice extent are both right at 12 million km² and both right at “normal”
Hansen predicted massive ice loss at both poles, particularly in the Ross Sea – which has gained a substantial amount of ice over the last 30 years.

www.epa.gov/climatechange/effects/downloads/Challenge_chapter2.pdf


I’ve always felt you can’t look at the extremes, you have to look at May and Nov……
Well, how about that!
“The coldest May in more than 50 years has left Canberra’s gardeners with frostbitten plants and dying blooms…”
http://www.canberratimes.com.au/act-news/coldest-may-in-50-years-20120529-1zgcr.html#ixzz1wvkWZjEj
If I were a warmista I would use trend lines that looked like DNA spirals instead of straight lines. That way I could point to my graph and say there’s the death spiral and journalists from the NYT, LAT or WAPO would nod like bobble-headed dolls and take me super serial. 🙂
http://www.youtube.com/watch?v=a9wmczxnT3c
Great idea Sundance! I recommend that you submit your proposal to GISS. If you make up some credentials, like being a leading climate scientist from a leading Multinursary like Penn State, you will almost certainly get a huge grant. Who knows, maybe even a Nobel Prize!