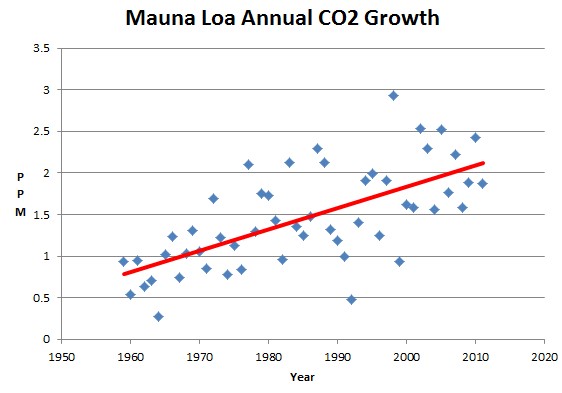
Since 1960, the annual increase in atmospheric CO2 content has more than doubled.
Scenario C would be the horizontal line y = 0 since the year 2000.
Scenario B would be the horizontal line y = 1.5 since 1988.
Scenario A is based on increasing annual emissions over time, and matches the red line above.
Scenario A is the forecast which temperature trends need to be compared against.


No sorry, Steve that is not correct. It is in fact Scenario B.
Emissions have exceeded Hansen’s scenario A. I believe he argued for 1.5% annual increase, and it’s been higher than that. One recent estimate has it at 1.9% since 1990. However, scenario A has a higher ppm than has actually occurred.
As of 2011 global pps is 390. Data here:
ftp://ftp.cmdl.noaa.gov/ccg/co2/trends/co2_annmean_gl.txt
And this is Hansens’ data here:
http://www.realclimate.org/data/H88_scenarios.dat
Note: I think it’s fair to argue that Hansen got other things wrong as well, maybe CO2 residency in the atmosphere perhaps, but it’s still not valid to argue for Scenario A.
I think I explained myself pretty clearly in the article. Hansen said : “Scenario B assumes a reduced linear growth of trace gases”
http://pubs.giss.nasa.gov/docs/1988/1988_Hansen_etal.pdf
It is clear from the CO2 data that growth is non-linear, and that the growth rate has increased from less than 1 ppm per year to more than 2ppm per year. That is more like exponential growth.
Linear growth would mean a fixed increase every year. Scenario B is not appropriate to Hansen’s original 1988 definition of scenario B,
Are you going to be critical of Hansen’s economic forecasting skills or his climate science forecasting skills?
Will,
I guess it depends on how you interpret his data. In Hansens data, is the CO2 by year, beginning of year, mid year, or end-of-year? If WRT end-of-year, then we are closer to A. If WRT beginning-of-year, the we are closer, but still above scenario B
May 2012 CO2 = 393.41
Year A_CO2 B_CO2
2011 393.7 391.0
2012 396.0 392.9
Scenario B is completely out of the question. I will provide more detail later, but I don’t see why this is a topic of dispute.
Scenario B is “linear growth of CO2” The first derivative of a linear equation is a constant. Emissions have not been constant, they have been increasing steadily.
Ben I think you need to look at the annual averages. CO2 atmospheric content cycles around a lot within any 12 month period.
Where I can’t agree with Steve on this is that Hansen’s scenario B “predicted” a certain temperature average if we got to 390 ppm CO2 and in 2011 we had 390 ppm. The rest is blowing smoke, I think. Because what sceptics should be critical of is Hansen’s claimed relationship between CO2 and temperature. All the other things he got wrong are more along the lines of curiosities.
I never said anything about temperature. I am talking about CO2 growth rates.
Steven,
When I take the first derivative of the Mauna Loa CO2 series, I get neither a linear increase nor a monotonically increasing exponential. The difference from year to year goes up and down. Sometimes its 1ppm, sometimes its 3.3ppm.
If this were an exponential function, then the first, second, third derivatives would be positive.
The second derivative of the Mauna Loa series goes negative.
Try it and see for yourself.
Will,
I studied both granular and aggregated data. The second derivative goes negative, so I don’t see CO2 growth rates as exponential.
The second derivative is positive. It is an upwards curvature.
Should read “As of 2011 global ppm is…”
Reblogged this on Climate Ponderings.
Hansen’s Congressional testimony in 1988 clearly stated Scenario A was “business as usual”.
http://climateaudit.org/2008/01/16/thoughts-on-hansen-et-al-1988/ A friend of mine obtained the transcript and posted it at CA.
The fraudsters at RC have rewritten history where any “scenario” validates Hansen’s predictions. The fact is, in 1988 when all this really began, Hansen painted a very bleak picture. In 1998 he changed the storyline and claimed Scenario B was being followed.
RC, Hansen and their sycophants are crooked as a barrel of fish hooks.