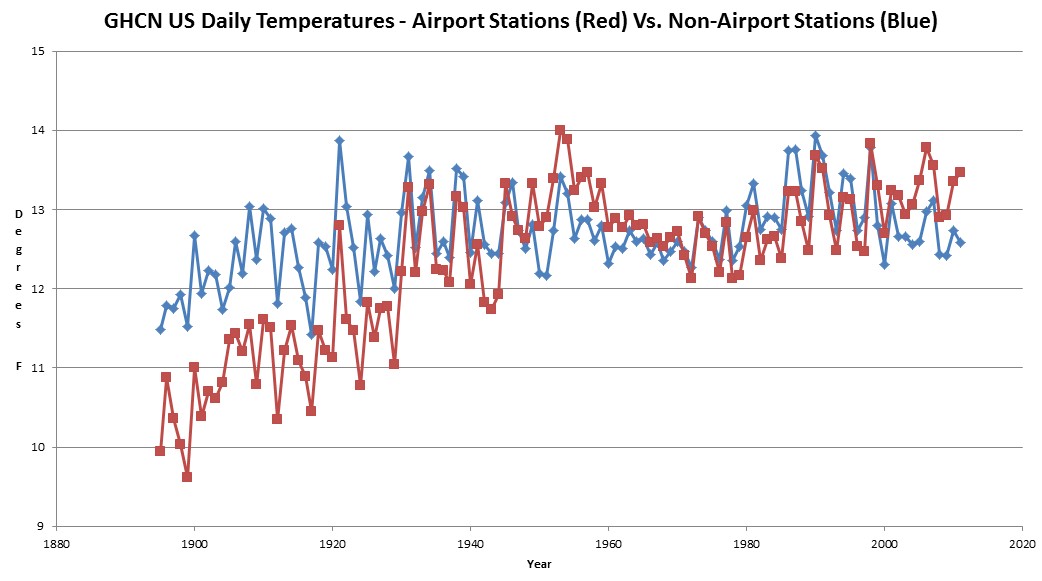
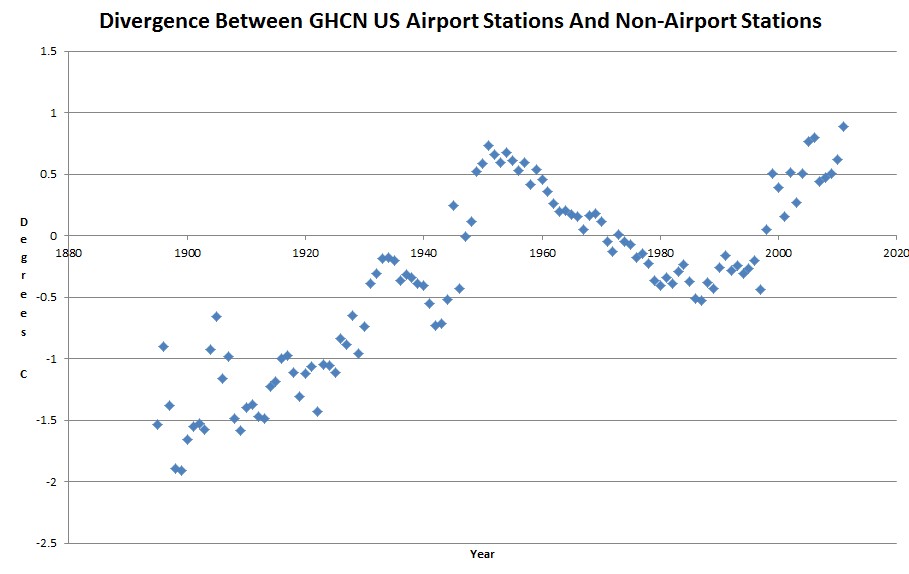
The GHCN US temperature record shows a large divergence between temperatures taken at airports, and those taken at the rest of the stations. This is most likely due to the introduction of pavement.
The first airplane flight was in 1903, so we can probably assume that most of the airport stations were very rural at the time – thus the much lower temperatures. As asphalt and pavement was added, the temperatures rose.
Next, look at the systematic divergence between the two data sets. What happened after 1990???
h/t to Michael D Smith for the suggestion.


Thanks Steve, really shows how they are manipulating the temperatures.
Thanks for the H/T… It seems strange that there would even be “airport stations” before there were airports! What strikes me is that from 1950 to 1985, the divergence has very little noise about its linear trend, meaning tight agreement with a changing bias. Airports were warmer in 1950, but by 1985, the other stations had outpaced them and now airports were probably more rural / had less bias than the others and were cooler (but all had UHI). After 1998, the airports had become warmer again (or more numerous in comparison, or the non-airport stations were being moved to rural areas again, or any number of possibilities)
And where is the mid 1930’s peak? Strange.
What’s brilliance without common sense and logic? If you can’t dazzle them with brilliance than baffle them with BS seems the common theme running through today’s climate science.
The climate clowns have taken a basic issue and turned it into a Rube Goldberg machine. Years ago, when I first started delving into AGW, that was my first thought, WHY isn’t station siting the first thing to examine in resolving anomalies? They are wandering around in a forest looking for trees.
There needs to be an anaylsis of weather at the CO2 “safe” level. What’s the point of lowering CO2 if the climate/weather was worse or no different than at the “unsafe” level? I suggest they practice keeping a standard kitchen oven with 2 degrees before trying to keep the earth within the same range. At least we know where the control knob is on the oven.
The international airport nearest me is also the site of the official temperature for the city. They did not pave their first runway until 1934, and it was built miles from any town, in the middle of farm fields. Of course it is now nestled in a concrete and asphalt jungle and has accordingly higher temperatures than even the surrounding city.
Good, now add rural MMTS.
What happened after 1990? I think it is screaming at you, in a Zwallian way. I think a proper curve fit to the adjustment data would reveal a breakpoint on or about June 24, 1988.
Steve, I wonder if there are any available data on the monthly or annual “pavement” and “asphalt” area amounts? If there are one could plot that info against the alleged temperature data and see what if any known or unknown correlations pop out.
Another step would then be to continue to empirically establish causation of asphalt and concrete (and other heat sinks and heat sources).
Maybe the bulk of the alleged Global Warming temperature “rise” isn’t caused by CO2 effects at all, maybe it’s caused by a more solid cause, Local Pavementing. Rock not gas. Heat sinks/sources on land not radiative gas in atmosphere. Not to mention, Data Fabrication. Sure seems like these are a major part of their fabricated claims of co2 climate doomsday rapture.
I enjoy your common sense approach to climate Steven. As a test engineer, I have been dealing with measurement issues for about 30 years now and find your average PhD researcher to have not a clue as the limitations of electronic, or even manual, data collection.
Regarding data after 1985, when did they start to implement the electronic weather stations as they replaced the old, mercury thermometers? To my knowledge, there was no side-by-side correlation and analysis done as a more accurate, but completely different, system replaced one in use for about 100 years. How much measurement bias is in those results since say the 1980’s?
Gary Halmbacher
Would like more info on proof or disproof of AGE.
This July, Des Moines the high temperature is averaging 96.3 with 8 days over 100. Meanwhile, nearby Ames is averaging 91.6 with no days over 100. Nearby Marshalltown is averaging 91.3 with one day over 100. So, if you look at Des Moines, you think it is almost as bad that the 1930’s, but with the two nearby stations, it is a run of the mill hot month.
It is ludicrous to have such a steep temperature gradient with max temperatures. The only way it could happen in nature is if you had a huge difference in rainfall, which has not occurred. If you look at the 1930’s, I doubt if anything of the sort existed. I believe this is a smoking gun that temperatures are being manipulated.
First, I want to thank you for the work that you do, greatly appreciated.
Now about this article, I thought the use of concrete vs asphalt might be interesting to study, but I found nothing about the temporal use of these two.
Finally, I know you like to figure out things that were there but nothing seemed to get them before. I just thought about something I had never seen expressed before about radiative transfers in the atmosphere. I have read that GHGs warm the surface because emission to space happens from a higher colder height in the atmosphere. Something I had never thought before, the amount of IRs emitted by a volume of air also depends on the amount of IRs in this volume. So emissions to space happen from a higher colder altitude, but this higher layer of atmosphere also contains more GHGs. So again, things are not as simple as I thought they were. And I know that some calculations found on the web do not consider this fact so I thought I would share that.
Keep up the good work.
Sorry for the bad English in the previous comment in the paragraph starting with Finally. What I wanted to say is that GHGs increase the height of emissions to space in the atmosphere. But the air at this height emits as a function of temperature AND GHG concentration. Clearly, a pound of air with a single CO2 molecule won’t emit as much IRs as the same pound of pure CO2 at the same temperature.
“What happened after 1990???”
ASOS
I’ll tell you another thing that happened after 1990 or thereabouts. Massive housing/business developments near airports. Look at places like DFW and Dulles. Build an airport and they will come.