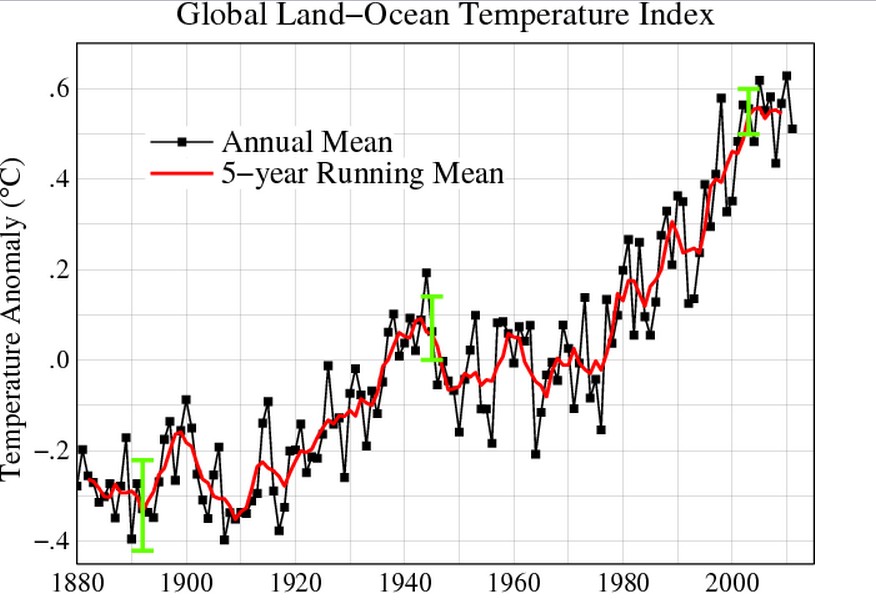
GISS shows temperatures declining from 1880 to 1912, with 1912 being one of the coldest years on record.
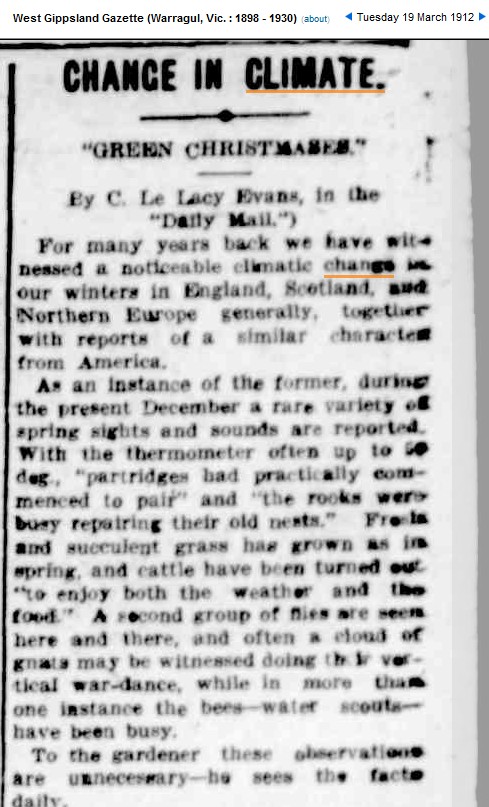
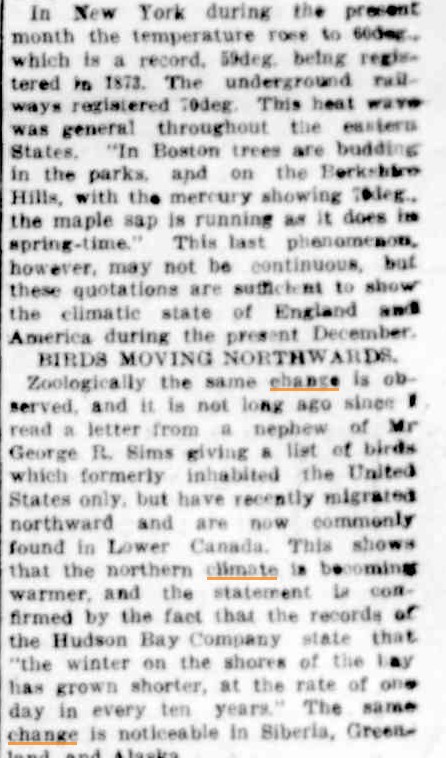
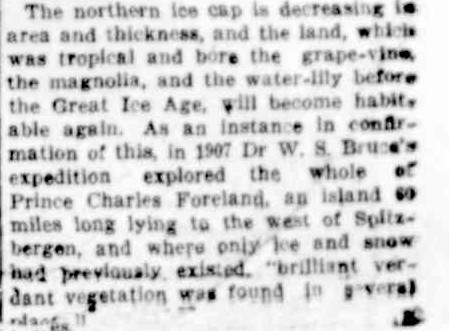
However, people who lived during that period reported the exact opposite. The polar ice cap was melting, glaciers were disappearing, winters were disappearing, birds were migrating north.
BIRDS MOVING NORTHWARDS. Zoologically the same change is ob- served, and it is not long ago since I read a letter from a nephew of Mr George R. Sims giving a list of birds which formerly inhabited the United States only, but have recently migrated northward and are now commonly found in Lower Canada. This shows that the northern climate is becoming warmer, and the statement is con- firmed by the fact that the records of the Hudson Bay Company state that”the winter on the shores of the Bay has grown shorter, at the rate of one day in every ten years.” The same change is noticeable in Siberia, Green- land, and Alaska. The northern ice cap is decreasing in area and thickness, and the land, which was tropical and bore the grape-vine the magnolia, and the water-lily before the Great Ice Age, will become habit- able again. As an instance in confir- mation of this, in 1907 Dr W. S. Bruce’s expedition explored the whole ofPrince Charles Foreland, an island 60 miles long lying to the west of Spitz-bergen, and where only ice and snow had previously existed, “brilliant ver-dent vegetatilon was found in several places.”


There have been good weather records back to 1912 and way beyond. Why would anyone need to manipulate temperatures when there is plenty of hard data? To pose the question is to answer it.
Hey,
there you go again,
We all know that Einstein’s generation had trouble reading thermometers!
I mean, I mean, a nukes and WW I and II are easy compared to reading thermometers!
Just ask Hanson, et al!
Lubes Motl had some good stories posted on his blog last year about unusually warm weather in Europe in 1911 and I believe he had some articles from New York papers as well. If you look at 1910-1944 and have wood for trees generate the trend – using hadcrut 3 and not 4 – you will see the trend is practically exactly the same as 1980-2000.
It seems somewhat self-defeating for climate hysterics to cool the pre-1940’s temperatures while at the same time admitting that most of the CO2 increase which has occurred since 280ppm historical levels, has done so post-1950. What they are doing is showing a steep rise in temperature early on, without the requisite CO2 forcing. to cause it.
A further problem they create is that their adjustments start to show a significant difference between middle tropospheric trends and surface trends. According to the climate models the middle troposphere should be warning faster as a ratio of the surface trends, but the land surface data is showing the opposite happening. This may be why there is a “missing hotspot”. There is a strong possibility that the surface adjustments have hidden it. This is the problem with ‘cheating’ in science (or at least not looking at the data objectively). When you fiddle in one place you create a new problem somewhere else.
This is the exact same graph that has been splattered all over the children’s science textbooks. it is quite sad that skeptical arguments like this aren’t in there though.