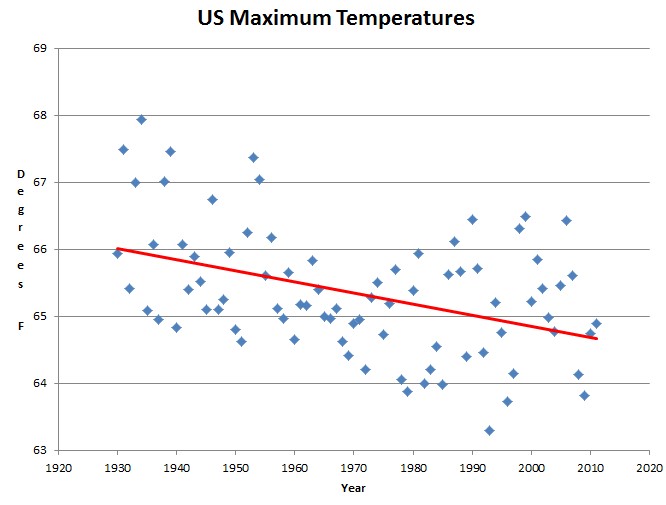
According to USHCN raw daily data, afternoon temperatures in the US have declined more than one degree since 1930.
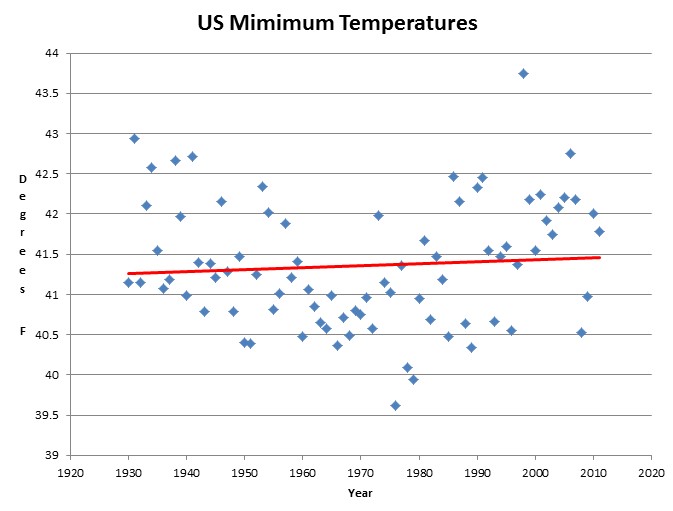
During that same period, US minimum temperatures have increased about a quarter of a degree
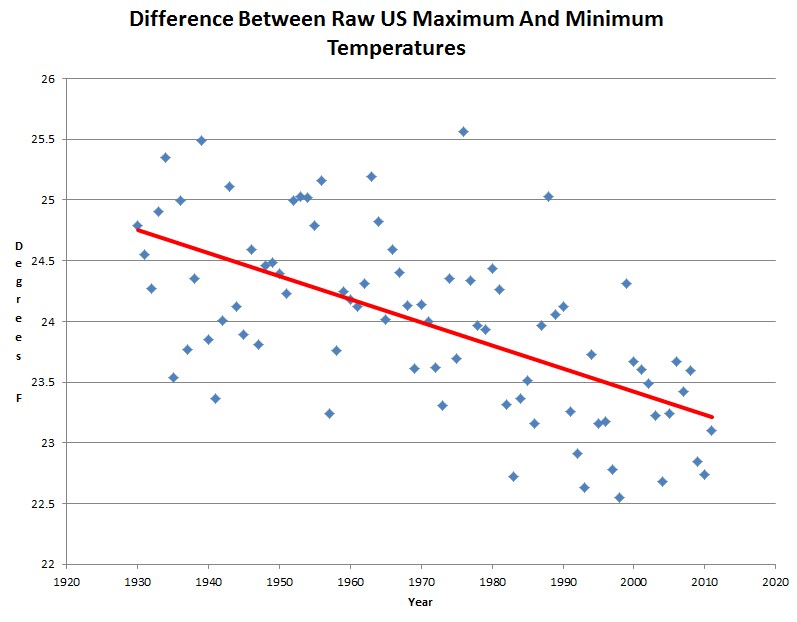
The next graph shows that the difference between maximum and minimum temperatures has dropped precipitously.
Strongly elevated nighttime temperatures are the primary symptom of the Urban Heat Island effect, which appears in cities and towns of all sizes.
USHCN makes a token political adjustment of 0.1 degrees for UHI, but the actual effect is more like fifteen times larger.


More than 15 times larger, given your thermometer on your bike.
Interesting that the BBC talk about UHI when it suits them.
The predicted rise in temperatures in the coming decades will be exacerbated by what scientists call the “urban heat island effect”, in which temperatures during heatwaves can be 6-7C higher in cities than in surrounding areas.
The new research, led by Professor Glenn McGregor of King’s College London, analyses data from recent heatwaves and concludes that the risk of heat-related deaths is greater in urban areas, especially in London.
http://news.bbc.co.uk/1/hi/uk/5284126.stm
Or this study carried out in Manchester.
What it revealed were a number of hot spots in Manchester and Stockport, with the leafy suburbs of South Manchester staying ‘greener’ and cooler. So was it a success? We asked Dr Sylvia Knight of the RMS.
“Definitely,” she said. “And we will be repeating it in other cities across the country.”
The theory behind the UHI effect states that built-up areas like city centre are up to 10C warmer than outlying rural areas because of the taller buildings, lack of green space and the heat absorbing properties of materials such as concrete and tarmac.
http://www.bbc.co.uk/manchester/content/articles/2009/05/06/060509_hot_manchester_results_feature.shtml
Hansen says that UHI lowers temperatures, and he is the greatest scientist who ever lived.
The Pielke, Christy et al recent paper cautions against use of min temps
http://pielkeclimatesci.wordpress.com/2012/07/18/further-confirmation-of-the-misinterpretation-of-miniumum-land-surface-temperature-trends-by-ncdc-cru-giss-and-best-as-part-of-a-diagnostic-of-global-warming/
This an old paper from JPL measured the UHI in Southern California and showed that the increase in heat waves was due mainly to UHI. It is a look back at how warmists trot out the global warming hysteria every time there’s a heat wave. As Yogi Berra said, ” It’s deja vu all over again”.
http://climate.nasa.gov/files/LAHeatWaves-JournalArticle.pdf