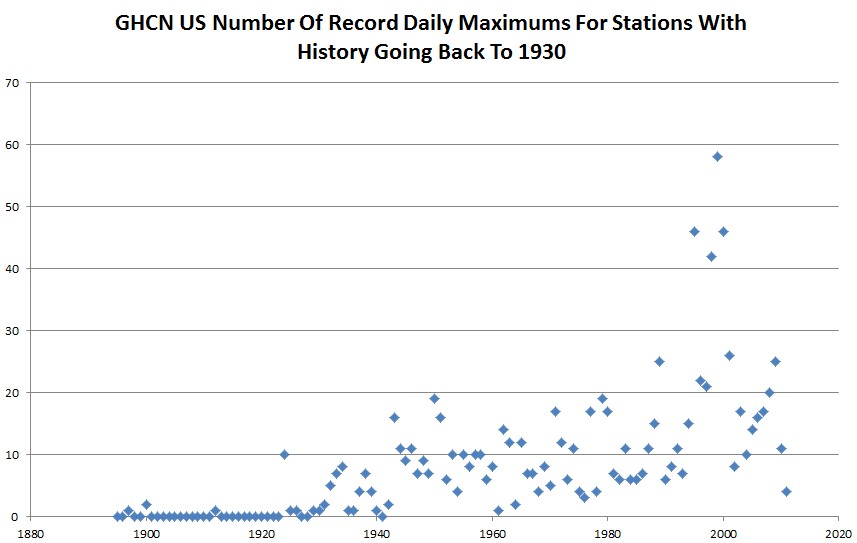
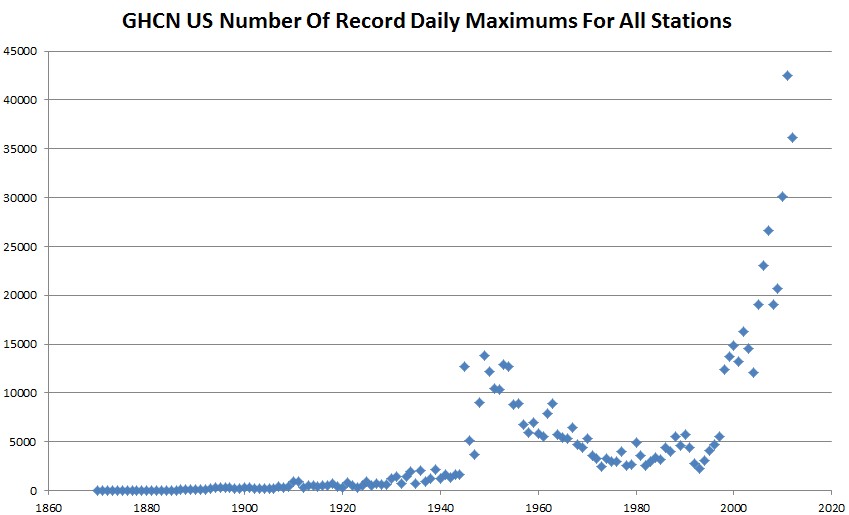
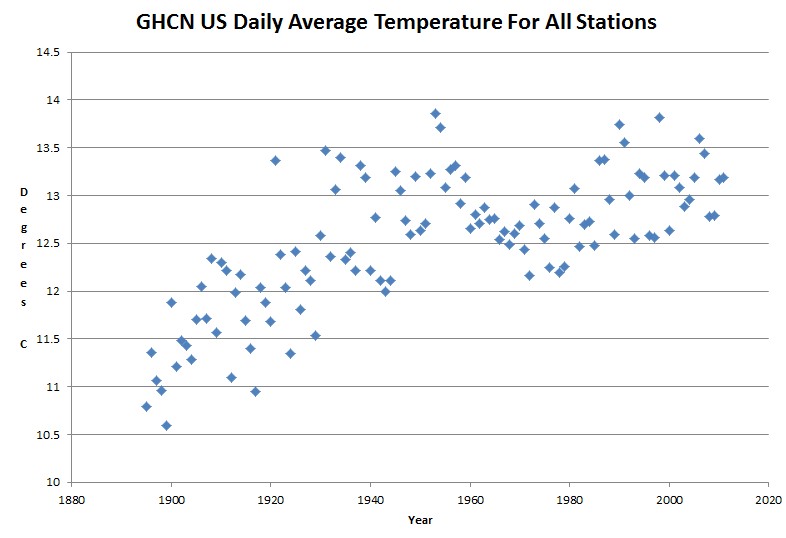
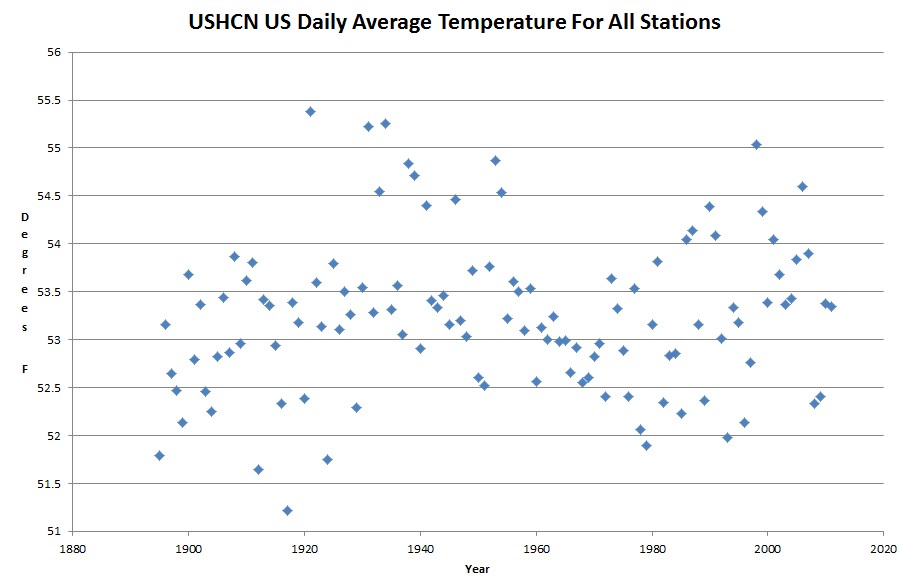
The GHCN US database has all the telltale signs of being complete garbage. Check out these graphs. The 1930s never existed.
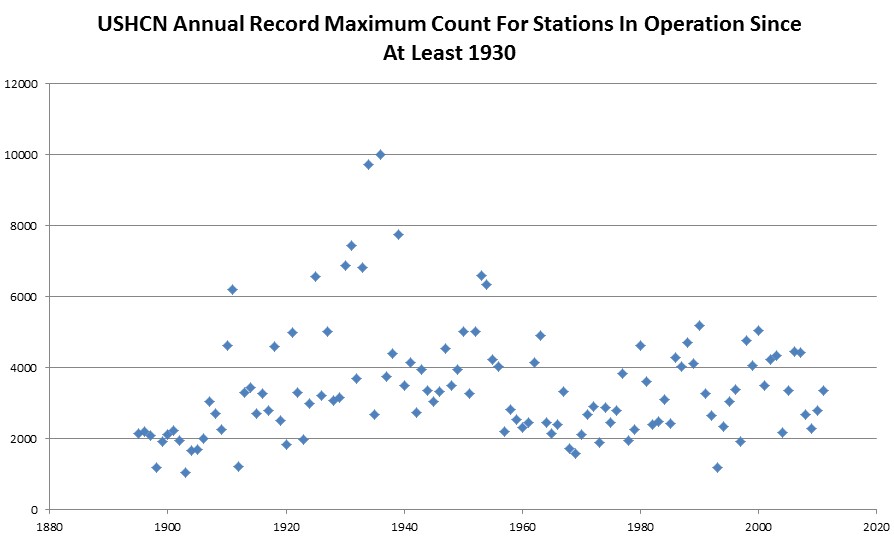
Now compare vs. the raw USHCN data, which show the 1930s as being the hottest decade.
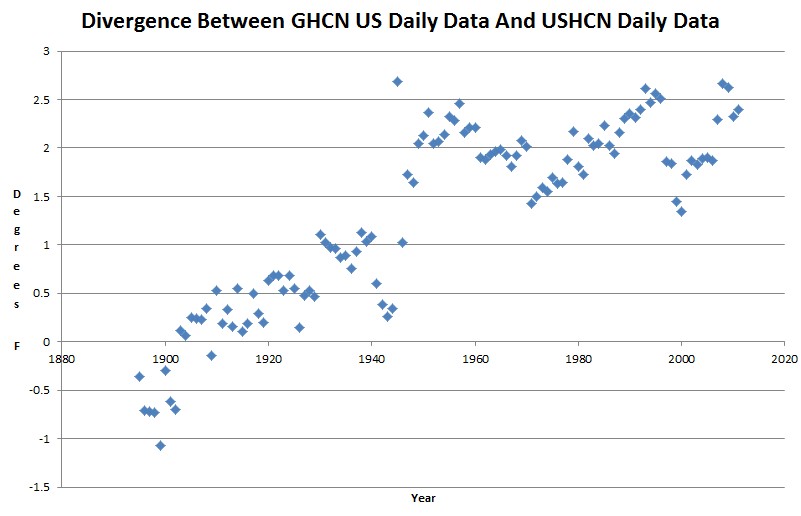
The divergence between GHCN US stations and USHCN US stations is massive.
But the real kicker for me is the divergence between airport and non-airport stations. This has all the telltale signs of intentional data tampering in the GHCN database. Patterns like that with sharp inflection points can not happen accidentally. Did the physical properties of airport stations radically change in 1950 and 1988? Something is seriously wrong with GHCN – which forms the basis of GISS.



Who collates GHCN data? This is remarkable. No wonder the UNEP wants all the national temperature data sets to be sequestered for national defense reasons.
NCDC which is a part of NOAA.
Well, you could explain the last graph by suggesting that the evolution of jets caused airports to be situated in out-of-town areas and that the 1980’s saw the development of towns overtake these out-of-town airports as planes became quieter due to the use of high bypass ratio turbofan engines.
I would need lots of $$$ to check that out 🙂
Mosher hasn’t shown up yet to go into cryptically worded convulsion over someone questioning GHCN veracity?
I can think of a test for veracity of the data… You have a way to pull daily individual station data (I’d like to steal your code and do a windows interface with graphics). You also have lots of historical data with highs and lows from different cities / places, hopefully near where the GHCN station data is (ideally from the same reporting station).
If it is easy to get to the historical newspaper data, randomly select 30 dates and stations that you can get one day’s highs and lows from. If not, just take whatever you have (it’s pretty random anyway), then compare the same 30 dates / places in GHCN. If the data are the same, no tampering. If otherwise, see if one direction is more common than the other. Calculate odds.
You can actually do a chi-square test on the frequency of appearance of certain numbers (like the last digit being distributed evenly). People tend to not be random when tampering with things. But it would not work well on distributions that have been converted from, say, °F to °C.
Sorry to keep suggesting things but not offering to help… I think it would be a blast to work on this sort of thing, but so far, I can barely get a question out there and you have 10 more cool posts up, so I would have a hard time keeping up, and am really busy anyway. I can barely find my old questions here 2 days later! But thanks for what you do.
You could get a blog, do your idea, and post it on your blog. I would visit your blog.
I have a blog, I do some cool stuff on occasion, check it out http://naturalclimate.wordpress.com . I’ll have some time in 3 weeks maybe, too much going on now. I sometimes have a few hours to do easy stuff, but my ideas are often a lot bigger than I have time for. Steve already has lots of code, and lots of tools, and he’s going exponential with the temp data sets. He’s far more effective than I am, which is why I don’t mind suggesting things. I don’t have any expectation I could get the data in 10 hours, even using his code, much less analyze it in another 10, though even that would be fun to learn. He’ll type in a few strokes and have a chart in minutes with his data explorer, otherwise he could not post at the rate he does. Just the way it is, I’m trying to be realistic. I can’t get it done anytime soon. He can take or leave any idea I have. He’ll find something interesting to post either way.
A study that shows that the data is not “catastrophically bad” can be found at: http://www.agu.org/pubs/crossref/2011/2010JD015146.shtml. Watts’s just released paper paints a negative picture related to siting, but one will have to wait to see how the paper holds up to peer review.
The data is crap. Use your own eyes.
Steve, my eyes are not as good as they were when I was younger. The past data changes faster than my eyes can focus.
The data is crap, has always been crap and they even admit it is crap. When they hope it represents realityin some way they are admitting their results are CRAP. GIGO!
http://data.giss.nasa.gov/gistemp/abs_temp.html
A discussion of limitations is full disclosure. It is not an admission that data is “crap.”
How about discussing the data I presented here?
The data is limited to the world of Make Believe. That is the “Full Disclosure” that I see.
Global Hysterical Calamity Network for Hansenized virtually real data.
http://gcmd.nasa.gov/KeywordSearch/MetadataTransformation.do?Portal=GCMD&KeywordPath=%5BParameters%3A+Topic%3D'CLIMATE+INDICATORS'%2C+Term%3D'AIR+TEMPERATURE+INDICES'%5D&EntryId=GISS_GISTEMP&MetadataType=0&lbnode=mdlb4