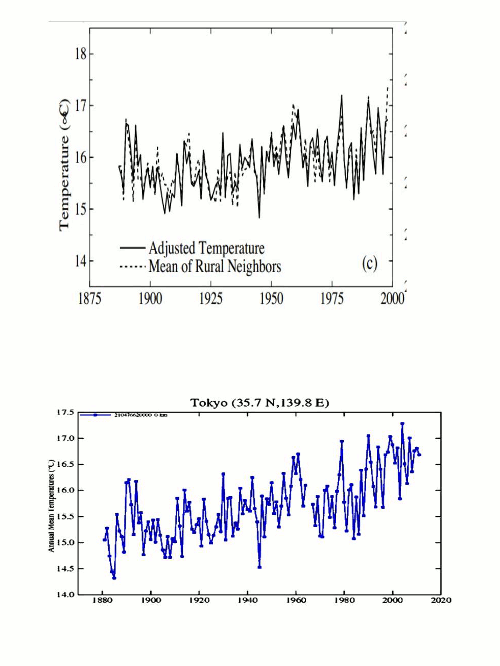
Hansen pulled the same trick in Tokyo that he did in Phoenix. The black and white is his 1999 UHI adjusted graph, and the blue is his current graph. He cooled the past by about a degree in order to create a non-existent warming trend.
Disrupting the Borg is expensive and time consuming!
Google Search
-
Recent Posts
- Gaslighting 1924
- “Why Do You Resist?”
- Climate Attribution Model
- Fact Checking NASA
- Fact Checking Grok
- Fact Checking The New York Times
- New Visitech Features
- Ice-Free Arctic By 2014
- Debt-Free US Treasury Forecast
- Analyzing Big City Crime (Part 2)
- Analyzing Big City Crime
- UK Migration Caused By Global Warming
- Climate Attribution In Greece
- “Brown: ’50 days to save world'”
- The Catastrophic Influence of Bovine Methane Emissions on Extraterrestrial Climate Patterns
- Posting On X
- Seventeen Years Of Fun
- The Importance Of Good Tools
- Temperature Shifts At Blue Hill, MA
- CO2²
- Time Of Observation Bias
- Climate Scamming For Profit
- Climate Scamming For Profit
- Back To The Future
- “records going back to 1961”
Recent Comments
- Bob G on Gaslighting 1924
- Bob G on Gaslighting 1924
- conrad ziefle on Gaslighting 1924
- Bob G on Gaslighting 1924
- Bob G on Gaslighting 1924
- arn on Gaslighting 1924
- conrad ziefle on Gaslighting 1924
- Gordon Vigurs on Gaslighting 1924
- conrad ziefle on Gaslighting 1924
- Robertvd on Gaslighting 1924


It would be interesting to graph the differences. You’d do a better job of that than me.
I wonder how minima appearing in the rural temps don’t happen to be minima in the city temps of the 1999 data
Hansen as clearly put a skew in this centered around the year 1980
Afaik, the Japan Meteorological Agency and its predecessors have records covering this period and going back much further.
Have the Hansen charts and their revisions been blessed by them?
While on the revision topic, was there ever a conclusion to the Reykjavik temperature adjustment debate?
Jim Hansen is the O J Simpson of climatology. He doesn’t have to answer for anything.
Any interested observer would note that during the time the US naval machinery in WWII got close to Japan in 1945, Tokyo (and most of the island) experienced by far the coldest year during the last Century.
This could be particularly observed few miles away from Tokyo
__at the west coast http://www.seatraining.de/H/Hi/hb-5.jpg , and
__at the east coast http://www.seatraining.de/H/Hi/hb-6.jpg
__and other locations as well.: http://www.seaclimate.com/h/images/buch/h_5.jpg
However, any one interested not to make James Hansen’s life and of his companions at IPCC etc too difficult, should not ask questions about the reasons for the extraordinary low temperatures throughout Japan just at the time when the Allies fought close to Japan’s shore., which is discussed here: http://www.seaclimate.com/h/h.html