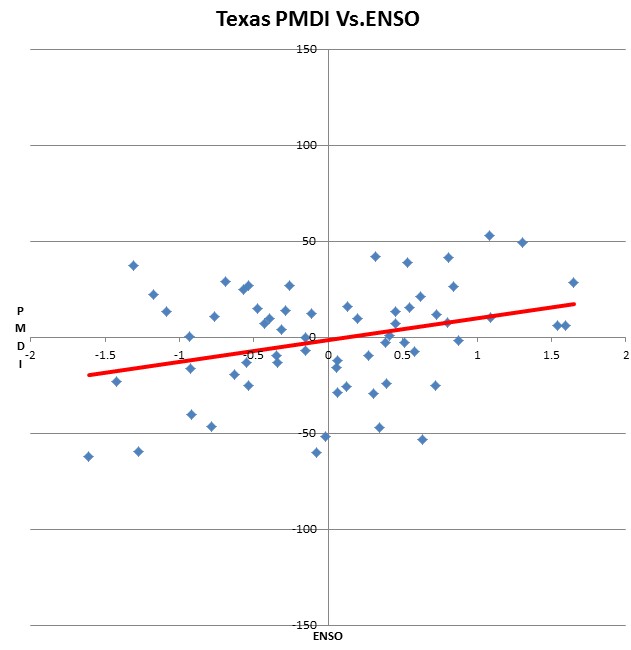
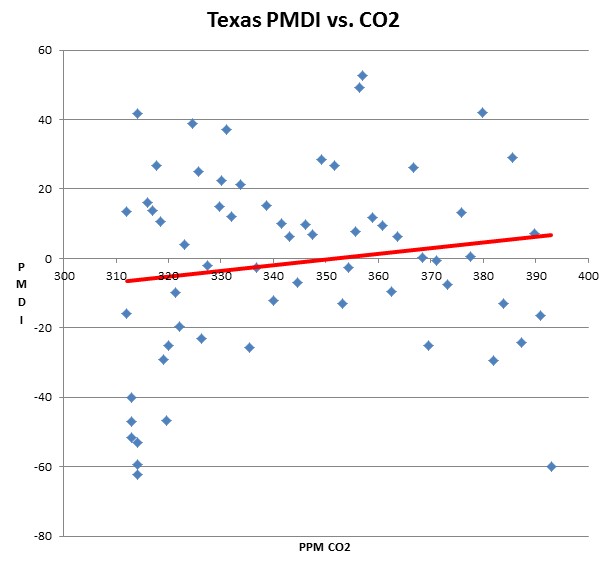
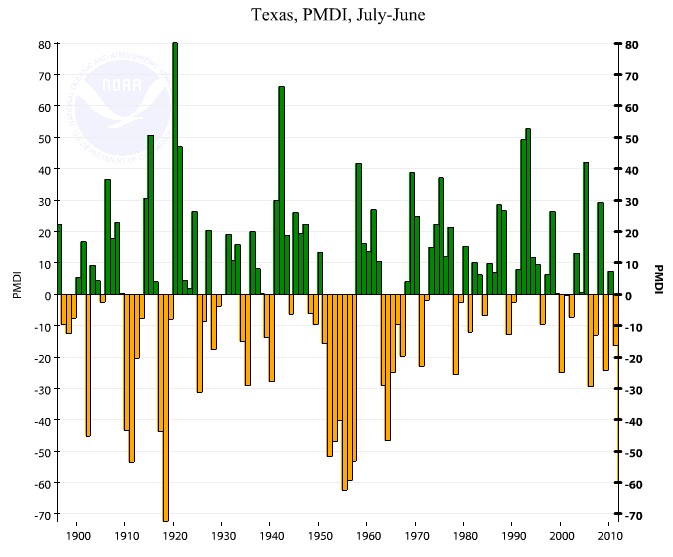
Andrew “Permanent Drought” Dessler has been telling us that drought in Texas is due to CO2. So I plotted PMDI vs CO2, and PMDI vs. ENSO.
Negative PMDI indicates dry conditions, and correlates quite well with La Nina. Texas has never been dry with ENSO above 1.0 (i.e. El Nino)
On the other hand, Texas drought shows anti-correlation with CO2. As CO2 has increased, Texas has had fewer droughts. What this tells us is that Dessler has never done any actual research on this subject using actual data. It took me 10 minutes to gather the data and do this analysis.
PMDI data from here
YEAR	ENSO	        CO2	PMDI
1950	-1.09	        312	13.38
1951	0.052083333	312.2	-15.74
1952	-0.0165	        312.8	-51.73
1953	0.343166667	313.3	-47.02
1954	-0.920166667	313.6	-40.14
1955	-1.608583333	314.1	-62.38
1956	-1.27675	314.3	-59.37
1957	0.633583333	314.5	-53.17
1958	0.805833333	314.7	41.68
1959	0.129916667	315.97	16.18
1960	-0.284416667	316.91	13.76
1961	-0.258416667	317.64	26.86
1962	-0.76275	318.45	10.54
1963	0.058833333	318.99	-29.11
1964	-0.787833333	319.62	-46.75
1965	0.719083333	320.04	-25.04
1966	0.273083333	321.38	-9.79
1967	-0.63125	322.16	-19.71
1968	-0.311916667	323.04	3.89
1969	0.531083333	324.62	38.8
1970	-0.570416667	325.68	24.89
1971	-1.423666667	326.32	-23.02
1972	0.877666667	327.45	-1.98
1973	-0.475333333	329.68	15.02
1974	-1.177166667	330.18	22.36
1975	-1.30675	331.08	37.03
1976	-0.112	        332.05	12.13
1977	0.621416667	333.78	21.33
1978	0.122583333	335.41	-25.73
1979	0.514333333	336.78	-2.74
1980	0.547083333	338.68	15.22
1981	0.06125	        340.1	-12.06
1982	1.092833333	341.44	10.1
1983	1.593416667	343.03	6.16
1984	-0.150333333	344.58	-6.88
1985	-0.397833333	346.04	9.81
1986	0.449916667	347.39	7.01
1987	1.64775	        349.16	28.57
1988	-0.53375	351.56	26.63
1989	-0.551833333	353.07	-12.98
1990	0.382166667	354.35	-2.6
1991	0.800416667	355.57	7.84
1992	1.3045	        356.38	49.19
1993	1.084833333	357.07	52.74
1994	0.724	        358.82	11.82
1995	0.195666667	360.8	9.52
1996	-0.34875	362.59	-9.64
1997	1.542	        363.71	6.23
1998	0.842333333	366.65	26.28
1999	-0.93075	368.33	0.25
2000	-0.532916667	369.52	-25.08
2001	-0.156166667	371.13	-0.47
2002	0.578083333	373.22	-7.39
2003	0.450416667	375.77	13.12
2004	0.409833333	377.49	0.63
2005	0.317083333	379.8	42.08
2006	0.301333333	381.9	-29.5
2007	-0.34025	383.77	-13
2008	-0.688416667	385.59	29.19
2009	0.390333333	387.38	-24.34
2010	-0.430666667	389.78	7.27
2011	-0.927416667	391	-16.42
2012	-0.081666667	393	-60.03


@Steve: Speaking of junk science, check out the errors in GCM’s:
“A paper published today in the Journal of Geophysical Research finds that current global climate models make “very large” errors in determining solar radiation at the surface of the Earth “due to ignoring the effects of clouds.” According to the authors, these very large errors can exceed 800 Watts per meter squared, which by comparison is about 216 times more than the alleged effect of doubling CO2 concentrations [3.7 W m-2].”
http://hockeyschtick.blogspot.ca/2012/07/settled-science-update-climate-models.html
Do clouds affect the weather?
I have to seriously question the accuracy of your CO2 and Texas PDMI plot. You never specify whether this is monthly or yearly PDMI and CO2 data. I have to assume it is monthly, but which month?.
The Mauna Loa Data started in 1958 with the lowest CO2 concentration of around 313 ppm: http://www.woodfortrees.org/data/esrl-co2
Meanwhile here is the June Texas PDMI index over time shows that in 1958 it was already positive around 3.61: http://www.ncdc.noaa.gov/temp-and-precip/time-series/index.php?parameter=pdsi&month=6&year=2012&filter=1&state=41&div=0
From that raw monthly (June) Texas PDMI data, I don’t see any values that fall below -5 after 1958 that would occur when CO2 concentrations were in the 313-315 range. But your plot seems to indicate that relationship happened.
Then I see June Texas PDMI values that fall to around -4.7 in 1996 when CO2 concentrations were around 360 ppm that also doesn’t show up in your plot. So how can anyone believe the accuracy of this chart and why didn’t you link to the raw data, including the corresponding years that this relational data is supposedly coming from?
When I actually take the data from these two data sources I get this:
CO2 (ppm) PDMI
1958 315.24 3.61
1959 315.97 1.12
1960 316.91 1.02
1961 317.64 2.54
1962 318.45 -1.63
1963 318.99 -3.99
1964 319.62 -3.54
1965 320.04 -1.09
1966 321.38 1.08
1967 322.16 -4.69
1968 323.05 3.63
1969 324.62 2.98
1970 325.68 -0.12
1971 326.32 -4.97
1972 327.45 -0.16
1973 329.68 2.99
1974 330.18 -2.09
1975 331.08 3.97
1976 332.05 0.19
1977 333.78 -0.40
1978 335.41 -3.12
1979 336.78 2.73
1980 338.68 -1.26
1981 340.10 1.45
1982 341.44 1.52
1983 343.03 1.48
1984 344.58 -2.48
1985 346.04 2.38
1986 347.38 1.10
1987 349.16 4.54
1988 351.56 -1.19
1989 353.07 0.84
1990 354.35 -0.57
1991 355.57 1.10
1992 356.38 6.18
1993 357.07 4.57
1994 358.82 -0.66
1995 360.80 2.36
1996 362.59 -4.66
1997 363.71 3.98
1998 366.65 -2.97
1999 368.33 1.75
2000 369.53 -3.02
2001 371.13 -1.04
2002 373.22 -1.68
2003 375.77 -1.12
2004 377.49 2.32
2005 379.80 -1.20
2006 381.90 -5.43
2007 383.76 4.20
2008 385.59 -2.41
2009 387.37 -4.27
2010 389.78 2.27
2011 391.57 -6.24
2012 394.99 -3.81
which produces a a downward sloping ling with the equation y=-0.0226X + 7.8452 and an R2 of 0.0324. Nothing even close to what your chart shows and completely runs counter to your conclusions.
It sounds like you are challenging the data. Are you really sure you want to go there? I will do a special post dedicated to making fun of your comment if you like.
http://www.youtube.com/watch?v=TcxpbhM0DaA
Just asking for you to provide the raw data that you used since it wasn’t voluntarily given and doesn’t match the raw data in my data links.
The data and links are there.
They weren’t there originally along with the actual data when I place my comment. At least I understand where they came from now.