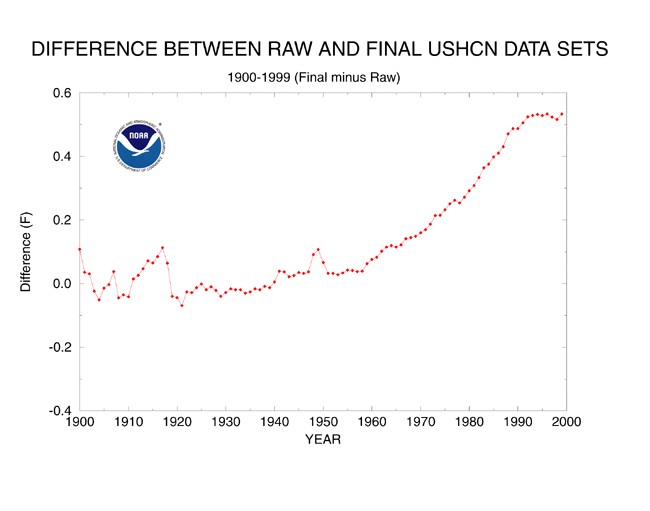
USHCN now adjusts the temperatures from the last 840 months in a row upwards.
In a normal error analysis for a large data set, scientists would assume that any non-systematic error is random. A miscalibrated thermometer is just as likely to read too high as it is to read too low. Human error has no systematic bias. The only systematic error is UHI, which should cause the corrections to be increasingly negative.
ts.ushcn_anom25_diffs_urb-raw_pg.gif (650×502)
So what are the odds of 840 months in a row having temperatures which were read too low by thousands of observers? Two raised to the 840th power. For all practical purposes, that number is infinity.
In other words, there is a 0% chance that the USHCN adjustments are correct, and 100% probability that they are politically motivated, or at best conformation bias.


The USHCN website says they provide data in 4 versions 1)Raw: the data in this version have been through all quality control but have no data adjustments. 2)TOB: these data have also been subjected to the time-of-observation bias adjustment. 3)Adjusted: these data have been adjusted for the time-of-observation bias, MMTS bias, and station moves, etc. 4) Urban: these data have all adjustments including the urban heat adjustments.
Would it also be possible to graph all four versions on the same graph to see how they differ?
Here are the differences between raw and final for Oklahoma. They are huge
http://stevengoddard.wordpress.com/2012/07/10/oklahoma-temperatures-worse-than-it-seems/
Is there an elevator speech explanation of the TOD observation bias adjustment. I do not understand it. For how long have thermometers automatically recorded the high and the low?
http://stevengoddard.wordpress.com/2012/06/23/time-of-gullibility-bias/
In a nutshell, in order to measure the max temp for a 24 hour day you have to read the max indicator after the maximum has occurred, so the TOD you read the max is important. Many of these readings were happening at 3pm, and because of varying conditions, hysteresis with instruments, etc. that is not necessarily the best time to read the max. Later in the evening is better.
Partly correct. The thermometers need to be set around midnight to give the correct reading every day.
Apparently alarmists believe that the urban heat island effect is making it cooler, thus temperatures have to be adjusted upward from the days where was little heat island effect. That makes a lot of sense. Kind of smokes them out as what they are.
Scumbags?
Steve, I have enormous respect for you. And, I agree with the comment.
It’s just that, in my view, we have to really push hard to keep the high ground, and not engage in the sort of unprofessional rhetoric that is de rigeur with the warmists. I’m particularly concerned at this moment because science and fact are starting to win the day. Letting our (quite justified) anger influence our rhetoric at this point can only be destructive, and hand Mann et. al. ammunition to distract and discredit “the deniers” with side-shows over trivialities that have nothing to do with the matter at hand.
Please don’t take this as a rebuke — not meant to be. Rather, a friendly reminder among those of us in the right that we have to keep our cool to get science back in the “science” of Climatology.
Good point, David. And thanks for the reminder to take the high ground.
So I’m not going to refer to Tom Karl or Jane Lubchenco as “sleaze” again.
I’m going to have to think of some other word to refer to them, I’m not sure what that is right now, I’m working on it though
Do we know for certain that the UHI adjustment alone is positive?
It is the only one which is negative
I find this chart astounding. The fundamental interpretation says we are worse at taking temperatures today than we were 100 years ago, which has no credibility at all. And, that our errors are uniformly to the negative. Again, can’t pass the smell test.
These are facts — raw data. It’s maddening that the press is so wholly bought and sold on AGW that “science” writers/reporters have no interest in examining facts like this — and asking questions.
The shape of the graph says it all. Warming coinciding with rising CO2 requires manufacturing the warming. Nothing could make this any clearer.
I love the calculation, which reveals that the odds of temps being read (and recorded) too low for 840 months as being 1 to infinity. You’ve blinded them with science, er, maths.
I don’t love the alarmists who prowl conservative or skeptical sites with one question and one question only, with words to this effect: So, you’re of the opinion that thousands of the world’s top scientists are in a left-wing conspiracy to shut down industry and promote a world government?
Well, no, I’m not of that opinion, eck-shu-eh-lehhhhhh… It’s not my job to have an opinion as to WHY the professional alarmists have done their dastardly deeds. Even in a murder case, the prosecutor doesn’t have to prove motive.
It’s enough for me to see, with evidence that even a mind such as my own can understand, the plain facts of what SOME (not necessarily thousands of) people have done.
The “adjustments” seem to have stopped in 1990, but the Oklahoma adjustments have gone all the way to 2011. Do these adjustments merely reflect the dropoff of stations being considered, and the higher proportion of low altitude, urban sites today?