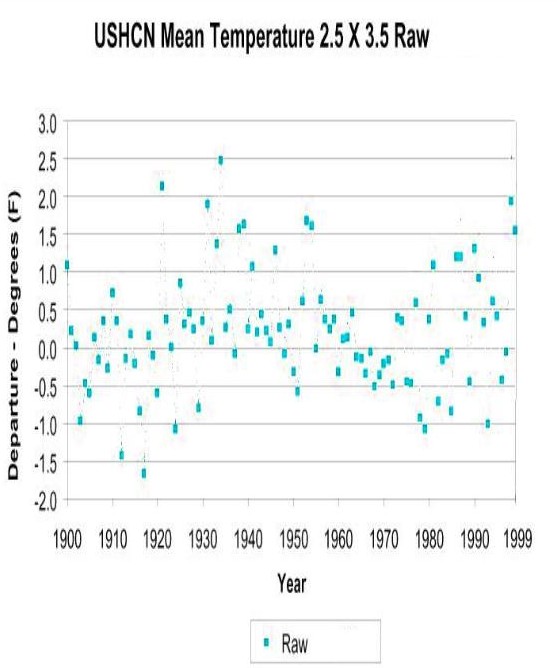
The USHCN graph below shows actual temperatures measured by thermometers in the US. The 1920s, 1930s and 1940s were the hottest decades, before Hansen and Tom Karl altered the data.
Disrupting the Borg is expensive and time consuming!
Google Search
-
Recent Posts
- Gaslighting 1924
- “Why Do You Resist?”
- Climate Attribution Model
- Fact Checking NASA
- Fact Checking Grok
- Fact Checking The New York Times
- New Visitech Features
- Ice-Free Arctic By 2014
- Debt-Free US Treasury Forecast
- Analyzing Big City Crime (Part 2)
- Analyzing Big City Crime
- UK Migration Caused By Global Warming
- Climate Attribution In Greece
- “Brown: ’50 days to save world'”
- The Catastrophic Influence of Bovine Methane Emissions on Extraterrestrial Climate Patterns
- Posting On X
- Seventeen Years Of Fun
- The Importance Of Good Tools
- Temperature Shifts At Blue Hill, MA
- CO2²
- Time Of Observation Bias
- Climate Scamming For Profit
- Climate Scamming For Profit
- Back To The Future
- “records going back to 1961”
Recent Comments
- Bob G on Gaslighting 1924
- Bob G on Gaslighting 1924
- conrad ziefle on Gaslighting 1924
- Bob G on Gaslighting 1924
- Bob G on Gaslighting 1924
- arn on Gaslighting 1924
- conrad ziefle on Gaslighting 1924
- Gordon Vigurs on Gaslighting 1924
- conrad ziefle on Gaslighting 1924
- Robertvd on Gaslighting 1924


I’m starting to wonder if the daily data has been altered at all? I think only the homogenization process has been tweaked to give anomalies an upward trend.
Here’s another raw comparison for 1933, 1934, 1998, and 1999 . The rightmost values is the number of temperature max’s above 38C for stations with months that reported at least 25 days of both mins and maxes (the stations used for comparison are stations that are in common to 1930,33,34,98,99).
year month count(*)
1934 7 15445
1934 8 9035
1933 7 7759
1933 6 6077
1934 6 4952
1998 7 4703
1933 8 3540
1999 8 3008
1998 8 2587
1998 6 2092
1999 7 2064
1934 5 1997
1998 9 1227
1934 9 1087
1933 9 995
1999 6 691
1999 9 383
1933 5 342
1933 10 264
1998 5 219
1934 10 192
1999 10 118
1934 4 115
1999 5 89
1999 4 22
1933 4 16
1934 3 11
1998 4 8
1998 10 5
1933 11 2
1998 3 2
1999 12 1
1933 2 1
Doing the query without regard to station commonality (1999 has about double the stations of 1933, 1934) gives something like …
The processed data seems to be *very* processed.
year month count(*)
1934 7 16384
1998 7 15292
1999 8 10031
1934 8 9561
1998 8 8847
1933 7 8306
1998 6 7480
1999 7 6636
1933 6 6338
1934 6 5233
1933 8 3874
1998 9 3752
1999 6 2678
1934 5 2196
1999 9 1503
1934 9 1299
It doesn’t matter. Even with the altered data, there has been no warming trend per century for the last 15 years. There has been a 1C trend for the last 30 years (which would equal a nett benefit to the planet if it warmed by that much anyway) and there has been a 1C trend for the last 60 years.
So it’s all good news as far as the empirical data goes.
It’s quite astonishing when you consider the Urban Heat Island effect and their ‘necessary’ adjustments.