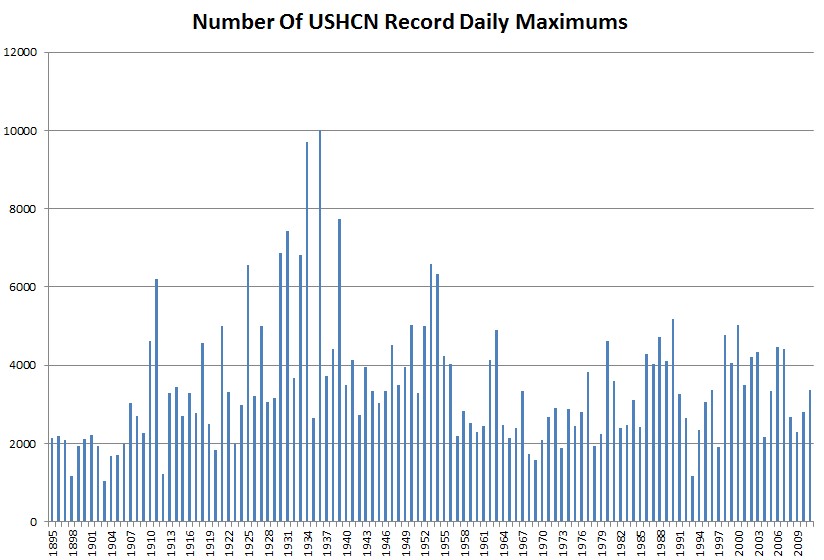
The graph and table below shows the number of current all-time record daily maximums held or tied, ranked by year. The current year is not included, because the data is not available yet.
When the data becomes available, it will become clear that the summer of 2012 was not remarkable compared to the summers prior to the 1960s global cooling. That isn’t going to stop the usual suspects from lying about it however.
1936	10011
1934	9704
1939	7743
1931	7424
1930	6862
1933	6808
1953	6589
1925	6567
1954	6338
1911	6206


Tell that to the NY Times.
“SO far 2012 is on pace to be the hottest year on record. But does this mean that we’ve reached a threshold — a tipping point that signals a climate disaster?”
http://www.nytimes.com/2012/07/21/opinion/the-climate-change-tipping-point.html?_r=1&hp
Found this heatwave index for the US squirreled away on the EPA site.
http://www.epa.gov/climate/climatechange/pdfs/print_heat-waves.pdf