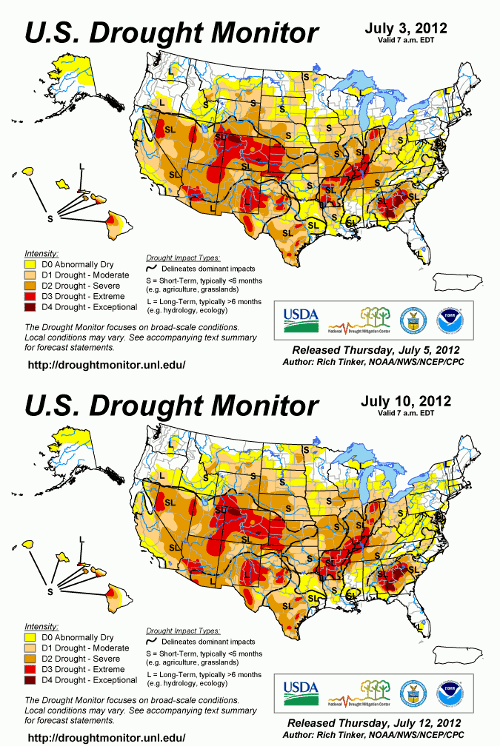
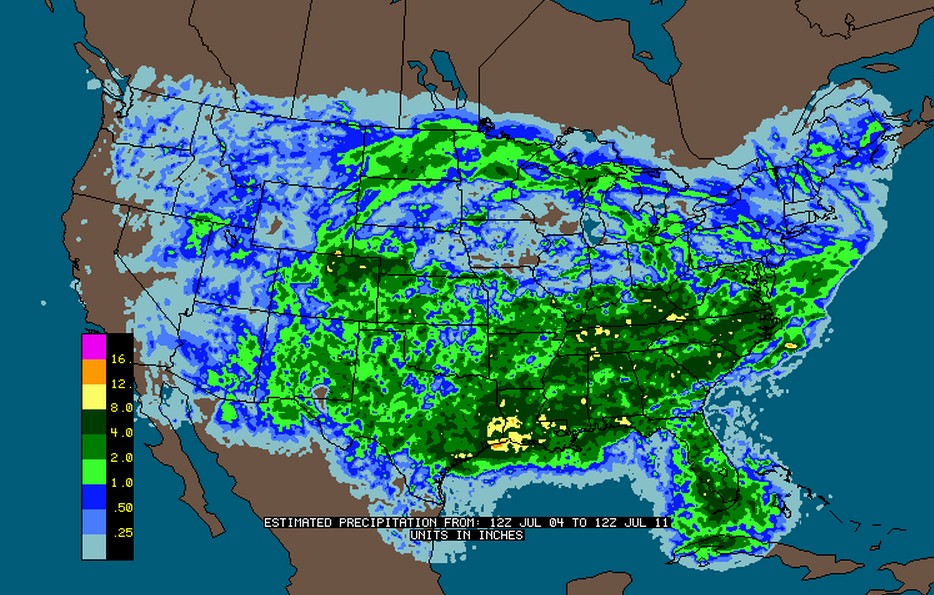
No change in Colorado/New Mexico/Georgia drought conditions over the past week, despite huge amounts of rain. This site was featured prominently by Al Gore this week.
Disrupting the Borg is expensive and time consuming!
Google Search
-
Recent Posts
- Gaslighting 1924
- “Why Do You Resist?”
- Climate Attribution Model
- Fact Checking NASA
- Fact Checking Grok
- Fact Checking The New York Times
- New Visitech Features
- Ice-Free Arctic By 2014
- Debt-Free US Treasury Forecast
- Analyzing Big City Crime (Part 2)
- Analyzing Big City Crime
- UK Migration Caused By Global Warming
- Climate Attribution In Greece
- “Brown: ’50 days to save world'”
- The Catastrophic Influence of Bovine Methane Emissions on Extraterrestrial Climate Patterns
- Posting On X
- Seventeen Years Of Fun
- The Importance Of Good Tools
- Temperature Shifts At Blue Hill, MA
- CO2²
- Time Of Observation Bias
- Climate Scamming For Profit
- Climate Scamming For Profit
- Back To The Future
- “records going back to 1961”
Recent Comments
- Bob G on Gaslighting 1924
- Bob G on Gaslighting 1924
- conrad ziefle on Gaslighting 1924
- Bob G on Gaslighting 1924
- Bob G on Gaslighting 1924
- arn on Gaslighting 1924
- conrad ziefle on Gaslighting 1924
- Gordon Vigurs on Gaslighting 1924
- conrad ziefle on Gaslighting 1924
- Robertvd on Gaslighting 1924


That chart is from July 3d. You would think the July 10th chart should show some improvement in many areas.
It is an animated gif which blinks between July 3 and July 10
In fact, it shows July 10th worse than July 3rd despite the rain.
Bottom line is how good/bad the harvest is this year.
Anyone invite Joe Bastardi to comment on the U.S. Drought Monitor specifically?
Steve, my screen is stuck on July 3rd. But I assume what you were saying was tons of rain and no improvement in drought. That is the very essense of droughtflood, similar to what happened in Texas last year. Droughtflood never happened until Dr. Hayhoe invented it in 2011. Now, due to Glorbal Weriding it happens all the time. Hayhoe is a leading climate expert (extreme sarcasm).
They show no change in Colorado, New Mexico or West Texas. Parts of Colorado have received over 10 inches of rain since June 1 and are listed as severe drought. It is a complete joke.
Thank you for being vigilant Steven, we know now that it is indeed the truth that you can’t trust the government. When any spokesperson for any of the government agencies or affiliates open their mouths I tune them right out as you can not believe them . They lie continually . Our government has reached the point where it is actively working against us and our best interests. It can not go on much longer. I know it sounds pretty doom prophetic of me but where is the light at the end of the tunnel ? Every time we have had a supposed conservative after a liberal president the supposed conservative has done nothing to reverse the liberal agenda. They just talk big and go right on serving their bankster masters. You can not trust anyone in government anymore . Sad sad sad
@ johnmcguire “Every time we have had a supposed conservative after a liberal president the supposed conservative has done nothing to reverse the liberal agenda. They just talk big and go right on serving their bankster masters. You can not trust anyone in government anymore. Sad sad sad.”
I think a lot of people agree with you, and each day more and more are realizing that the false left/right approach to government has broken down. Sad? Yes, sad and frightening, very much so, but it is also an encouraging development that people are waking up. The growth of digital information technology is the biggest thing since Gutenberg and at last the average person — if he is interested! — is able to find out just how his life, his property and his liberty are being taken away. That realization, that acknowledgment of a problem is the biggest, most important thing to happen in our lives, and YOU have figured it out. So what is the solution? I don’t know, but I know that every day there are more and more people trying to figure out an answer. Chances are, we will find many different solutions, all of which will help — but the important thing, the one thing which is critical and which is indispensable is that more people understand the nature of the problem. Unless the majority of people realize that voting conservative or voting liberal just gives us the same mess, year after year, we will remain stuck. Don’t be sad, don’t despair. Tell your friends, cherish your family, speak the truth, and NEVER let the bast@#ds grind you down. The good guys will win this one and YOU are one of the people wearing a white hat.
Hope your ‘early apples’ are a success John, and you have a good supply of fire-wood (to last the next two Winters.) The ‘good guys’ wont win, Nature will treat us all equally, but the vigilant may survive the longest.
Steve,
What do you think of this BBC article concerning Cryosat?
http://www.bbc.co.uk/news/science-environment-17803691
“This figure is very similar to that suggested by PIOMAS (Panarctic Ice Ocean Modeling and Assimilation System), an influential computer model that has been used to estimate Arctic sea ice volume, and which has been the basis for several predictions about when summer sea ice in the north might disappear completely.”
Complete crap. Cryosat shows one meter greater average thickness than PIOMAS
Too vague. 😉
You didn’t even state the species that generated the crap.
Climatus exemplum fraudatio?
The author of the chart is Rich Tinker. Methinks Mr.Tinker has Tinkered with the data.
I notice that Nashville area has gone from Moderate Drought to Severe Drought since the 3rd. Are you freeking kidding me? It has been raining non-stop all week with forecast rain for at least the next 10 days! I am thinking of buying stock in canoe’s.
Same here in Colorado. The US Drought Monitor is clearly being used as a political tool and I am not surprised that they are creating droughts where none exist.
I just noticed this very same graph being displayed on Weather.com, is complete BS! It doesn’t even match up with their own historical information or prediction patterns. Total crap!
CNN has a map showing the entire SW in red, including all of Texas.
You can also get weekly precipitation from NOAA itself here: http://water.weather.gov/precip/