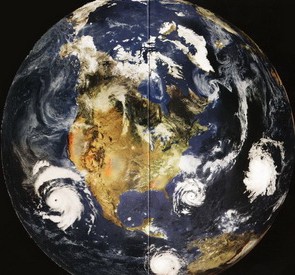
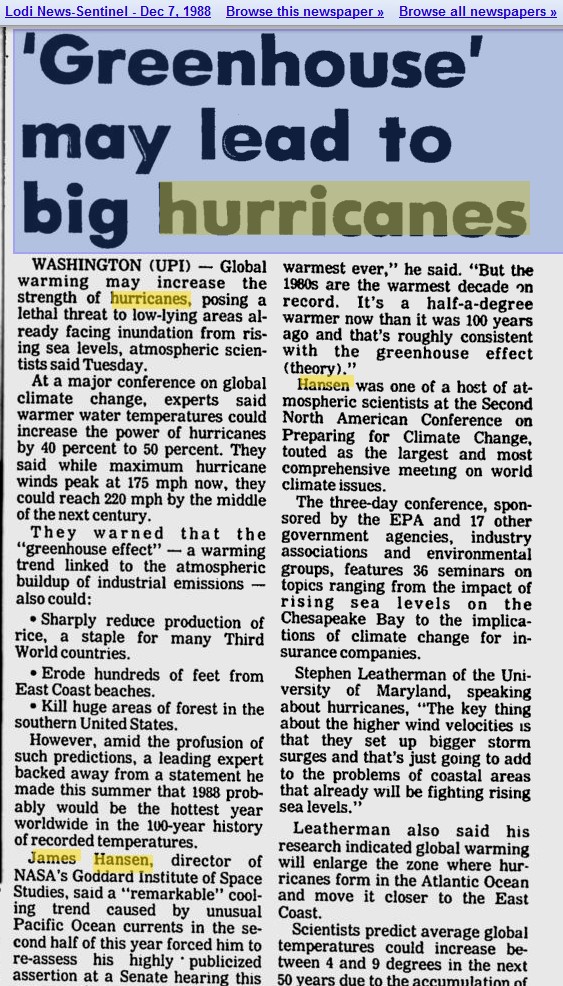
According to Hansen, the 1880s was tied for the coldest decade at -0.27 C anomaly. It was also the decade which the United States was hit by the most hurricanes – twenty-six including six major hurricanes. CO2 levels were below 300 ppm at the time.
Nobel Prize Winners like Al Gore tell us that higher temperatures and CO2 mean more and stronger hurricanes, because they are complete morons and have no idea what they are talking about.
1880    Aug   # TX, S3                          3
1880    Aug     FL, SE2, NE1, NW1               2
1880    Sep     NC, 1                           1
1880    Oct     FL, NW1                         1
1881    Aug     GA, 2; SC, 1                    2
1881    Sep     NC, 2                           2
1882    Sep     FL, NW3; I-AL, 1                3
1882    Sep     LA, 2; TX, N1                   2
1882    Oct     FL, NW1                         1
1883    Sep     NC, 2; SC, 1                    2
1885    Aug     SC, 3; NC, 2; GA, 1; FL, NE1    3
1886    Jun     TX, N2; LA, 2                   2
1886    Jun     FL, NW2; I-GA, 1                2
1886    Jun     FL, NW2; I-GA, 1                2
1886    Jul     FL, NW1                         1
1886    Aug     TX, C4                          4
1886    Sep   # TX, S1, C1                      1
1886    Oct     LA, 3; TX, N2                   3
1887    Jul     FL, NW1; I-AL, 1                1
1887    Aug   * NC, 1                           1
1887    Sep     TX, S2                          2
1887    Oct     LA, 1                           1
1888    Jun     TX, C1                          1
1888    Aug     FL, SE3, SW1; LA2; I-MS, 1      3
1888    Oct     FL, NW2, NE1                    2
1889    Sep     LA, 1                           1


These are the only ones of which the news has come to Harvard,
And there may be many others, but they haven’t been discovered.
With apologies to Tom Lehrer.
With their new hypersensitve detection equipment, the National Hurricane Center should have no trouble coming up with 26 hurricanes. Even if hurricane force winds are contained within only .001% of the storm.
Not one named storm in the Atlantic since June 26…is this a record or what? A sign of climate change, no doubt.
This is exactly what they predicted
About a third of the measurements for the 19th century were below 300 ppm. The average for the 19th century was about 335 ppm. See chart from which the ~280 ppm (or 292 per Callendar) was cherry-picked:
http://www.warwickhughes.com/icecore/call2.jpg