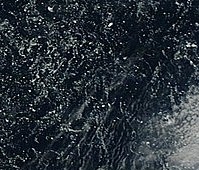
There is a lot more ice in the NSIDC ice-free areas than I realized. The satellite image shows that a lot of the non-existent ice is dark
//ARCTIC.IO/OBSERVATIONS/8/2012-08-21/8-N74.298483-W168.189975
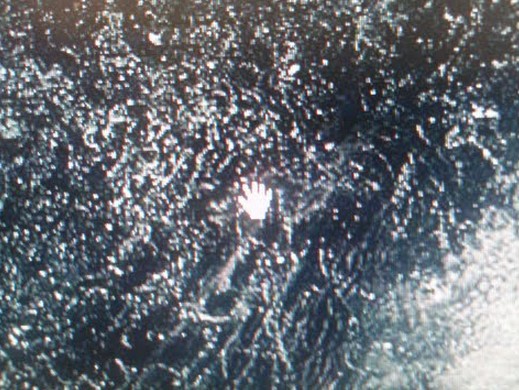
Here is the same image photographed from my screen using my phone, which does some color/gamma correction automatically. There is a lot more ice than the satellite image makes obvious.


That hand-shaped iceberg looks pretty big!
Now I’ve seen everything. A guy who claims to write image processing software for a living taking a picture off his monitor with a camera phone to try and prove a point…
I have that special kind of denier phone which creates ice where there is none.
Perhaps I am not near my computer?
Able to take pictures of your screen, but not near the computer… Steven, do you perchance have a very long monitor cable?
Perhaps I am working at someone else’s computer?
Steve. I think you should do your own area calculation.
The imagery exists going back years. Pull up the entire arctic. reshoot every screen with
your cell phone and count the pixels.
Ohand it appears that your monitor is out of calibration. The first thing you need to do is fix that.
when you have a process down be sure to share all your pixel counting so we can correct your mistakes again. when it comes to changing your data, you are to ice what hansen is to temperature.
The winter storm which hit the Arctic very early this year seems to have confused quite a few people.
Keep counting pixels, and make sure to post your results. of course dont forget to correct for the projection. You are to counting pixels what hansen is to recording temperature.
make sure you don’t count white caps. New storm on its way, get busy.
Completely lame.
(P.S. Sorry to spoil the fun, but dark pixels mean ice floes that are smaller than the pixels themselves. If the pixel is ~1/5 the intensity of a pixel from the centre of a large floe (what few there are), that means you’re looking at a concentration of ~20%.
As I’ve been saying for ages, there’s a very large fragmented fringe this year, which is borderline for detection by IMS and below detection for passive microwave sensors. It’ll be gone by the September minimum.
Even if it is gone, unlike 2007 the water will be cold and will refreeze very quickly.
Steve if you are correct, then the exposed ocean water will be loosing a lot of heat right now. One would expect to see a very rapid, possibly record breaking, gain in sea ice. Let’s see what happens over the next month or two.
Goddard predicts a record refreeze?
DMI is still above freezing steve..
lets discuss triple points again.. that was fun
Mosher predicts ice-free Arctic.
The Russian Can See it.
http://www.aari.ru/resources/d0015/arctic/gif.en/2012/20120821.GIF
It must be that foreign ice. Visible only in Cyrillic Metric Units.
A simple language barrier.
yes. that is 10% to 60% concentration ice. you are familar with 10%. its the typical percentage of questions you got right on your math test
Canadians see 20%, 40% and 70% ice where American Government scientists claim none exists. Climate scientists assure us that this is standard AGW precision.
http://ice-glaces.ec.gc.ca/prods/WIS56CT/20120820180000_WIS56CT_0006608484.gif
Sample of the 10% ice concentration Mosher assures us doesn’t exist.
http://icefloe.net/Aloftcon_Photos/zp-core/full-image.php?a=2012&i=20120818-0101.jpeg&q=75&wmk=!
It’s the wrong kind of ice!!
The ice extent on IMS seems to making a bit of comeback and I doubt if it will be gone by September.The Minimum might not be in September it might be in August because of the cold surface temperature in the arctic. I am not concerned if we reach a new minimum but I can’t see the trend of the last 30 years or so of arctic ice decline going on because I see no reason why it should ,if the ice is declining because the Earth is getting warmer then why is the Antarctic sea ice not declining at the same time.
Various explanations have been offered. One is due to atmospheric and ocean current circulation in that region. Another relates to ozone and UV.
According to UAH, the southern hemisphere is warming at less than half the rate of the northern hemisphere.
Over the last 10 years, the trend at the n.pole is +0.25c/decade while at the s.pole it is The trend at the south pole is -0.12c/decade.
Over the last 30 years, the figures are +0.57c/decade at the n.pole and zero at the s.pole.
Corrected:
According to UAH, the southern hemisphere is warming at less than half the rate of the northern hemisphere.
Over the last 10 years, the trend at the n.pole is +0.25c/decade while at the s.pole it is
-0.12c/decade.
Over the last 30 years, the figures are +0.57c/decade at the n.pole and zero at the s.pole.
IMS has several challenges to overcome on data sources last I looked.
As a plus it is a multi sensor approach and as a plus it has the finest grain
data sources. As a minus it has human analysts in the loop and it appears to be lagged with respect to it’s updates. It will probably be the last record to fall.
You know you are in denial when you start looking for a data source to confirm your dis belief.
Still I hold out hope for the GCPII. Goddard Cell Phone ice Index. he has shown us all the way to better data processing by using un calibrated monitors, unspecified data projections and gamma correction via software designed to take better pictures of flesh tones
I’m having trouble getting excited about something of no relevance to anything… Two thirds of the ice melts every year, it’s called summer. People are getting worked up by a single digit % change that will last a few weeks at best. I guess if there was some sort of negative impact of AGW that people could be pointing to, the focus would be on that. But instead people are getting emotive over this triviality.
This has become far more absurd than counting angels on the head of a pin. What is ice? What isn’t ice? It is all in the eye of the beholder.
Exactly. The whole scam was based on how it affects wildlife. Obviously wildlife is not affected this year, because there is plenty of ice near Alaska. The fact that NSIDC doesn’t count that ice becomes irrelevant.
As measurement technology improves (for example microwave imaging of the arctic), adjustments need to be made. Understand now?
I see now. Missing vast areas of ice is an improvement in technology.
Three cheers for the GCPII. goddard cell phone ice index.
I dub thee…. Count De Pixel
You can see the darker ice much better with the Terra 367 band pretty nicely.
http://rapidfire.sci.gsfc.nasa.gov/imagery/subsets/?mosaic=Arctic.2012235.terra.367.4km
And the Canadians are picking it up on RadarSat for their analysis charts as well.
http://ice-glaces.ec.gc.ca/prods/WIS45CT/20120822180000_WIS45CT_0006608711.gif
Looks like 10% of strips and patches in 90-100% concentrations along with 20% of medium floes(100-500m sized). The ice looks to be headed in a W to NW direction towards Russia at about 8 nautical miles a day in the Chukchi Sea as of today.
Concentrations are higher further south toward the Bering Strait (NW of Point Barrow). 20-70% concentrations with floes running from 100-500m up to between 2-10km as shown in the egg codes.
http://ice-glaces.ec.gc.ca/prods/WIS56CT/20120820180000_WIS56CT_0006608484.gif
Brian D,
Thanks for the links. Excellent
@ Steven Mosher
———–
Are the present conditions outside the realm of climate variability as currently understood ?
OK, this is just funny.