Disrupting the Borg is expensive and time consuming!
Google Search
-
Recent Posts
- Gaslighting 1924
- “Why Do You Resist?”
- Climate Attribution Model
- Fact Checking NASA
- Fact Checking Grok
- Fact Checking The New York Times
- New Visitech Features
- Ice-Free Arctic By 2014
- Debt-Free US Treasury Forecast
- Analyzing Big City Crime (Part 2)
- Analyzing Big City Crime
- UK Migration Caused By Global Warming
- Climate Attribution In Greece
- “Brown: ’50 days to save world'”
- The Catastrophic Influence of Bovine Methane Emissions on Extraterrestrial Climate Patterns
- Posting On X
- Seventeen Years Of Fun
- The Importance Of Good Tools
- Temperature Shifts At Blue Hill, MA
- CO2²
- Time Of Observation Bias
- Climate Scamming For Profit
- Climate Scamming For Profit
- Back To The Future
- “records going back to 1961”
Recent Comments
- Bob G on Gaslighting 1924
- Bob G on Gaslighting 1924
- conrad ziefle on Gaslighting 1924
- Bob G on Gaslighting 1924
- Bob G on Gaslighting 1924
- arn on Gaslighting 1924
- conrad ziefle on Gaslighting 1924
- Gordon Vigurs on Gaslighting 1924
- conrad ziefle on Gaslighting 1924
- Robertvd on Gaslighting 1924
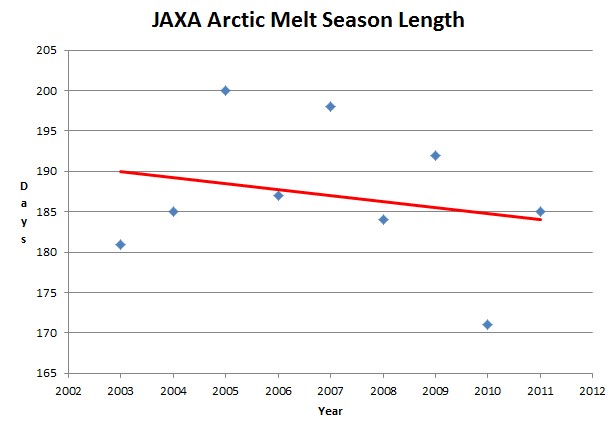
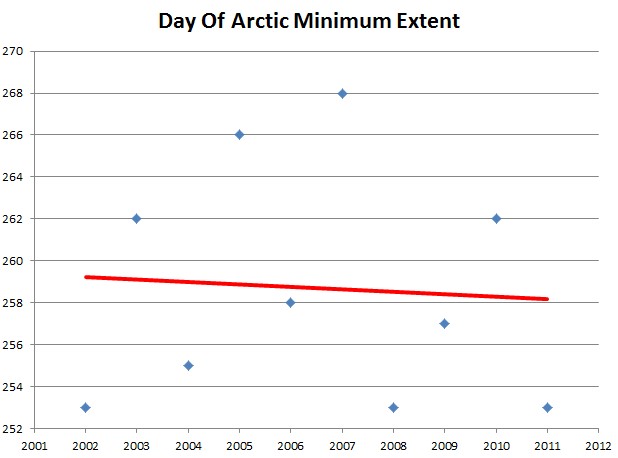
Arctic Melt Season Getting Shorter And Ending Earlier
This entry was posted in Uncategorized. Bookmark the permalink.


IT”S. A. TREND!!! (eek)
Steve, why not show all the years? The freeze-up trend is positive from 1979-2011, at a rate of 2.4 days per decade. And since 2002 (the date you show) every year has had a melt freeze-up date on the 9th or later, so having a freeze-up either in the 2nd or 3rd week of September. It is interesting though that your freeze-up dates differ from mine, but mine are based on 5-day running means so that could be part of the reason why.
Julienne,
JAXA only goes back to 2002. I`m showing all of the data they publish.
Here are the freeze-up dates based on 5-year trailing running means of the ice extent (note the minimum date ends up shifted by two days each year if I use the 5-day trailing mean rather than the 5-day centered mean).
2002 9/14
2003 9/18
2004 9/20
2005 9/22
2006 9/17
2007 9/18
2008 9/20
2009 9/13
2010 9/21
2011 9/11
I think it would be hard to argue from this data that there has been a significant trend towards earlier freeze-up.
Julienne,
I don’t see anywhere where Steve said “significant”.
It was interesting to note however, that you asked why he didn’t show all the years. Is there some other data you were thinking of?
Who put that red line in and who did the software to generate it? Can we have source please?
If you look at the scientific website
http://www.ijis.iarc.uaf.edu/en/home/seaice_extent.htm
Look at the minima date for the dashed lines, it is defintely moving to the right towards October for 1980 onwards and then if you look at the solid lines they are not going towards Sept 1st either are they?
It is looking like sub 4 and late Sept minimum at the moment.
Andy
Where is all this ice located which you expect to melt?
Steven,
Do you have good reference material for WindSat and AMSR-E algortihms? I am currently digesting http://www.meto.umd.edu/~zli/METO401/AOSC625/Readings/Microwave%20RS/Weng%20remote%20sensing%20notes.pdf
Dave, I meant the entire satellite record, not just the AMSR-E record. If Steve were to show all the years during the satellite era he would have a positive trend.
Then you’d start in the 1970’s. That was when there was an expansion in ice cover.
POSITIVE TREND?!?!
Julienne just wants to be a trend setter. 😉
Shooter, if you know of a continuous data set in the 1970s please pass it on. We have data gaps between ESMR and SMMR, so having a complete record of the date of the minimum extent isn’t out there unless you start in October 1978 when SMMR was launched.
Here is a graph from Cryosphere Today of all of their satellite data:
http://arctic.atmos.uiuc.edu/cryosphere/arctic.sea.ice.interactive.html
The dataset is here:
http://arctic.atmos.uiuc.edu/cryosphere/timeseries.anom.1979-2008
I wonder if Julienne works for NSIDC, that might explain why she is so defensive of them.
Of course she does.
Well, that explains a lot, thanks Steve. She holds the opinion of many of them over there and is good reason why we shouldn’t trust the NSIDC.