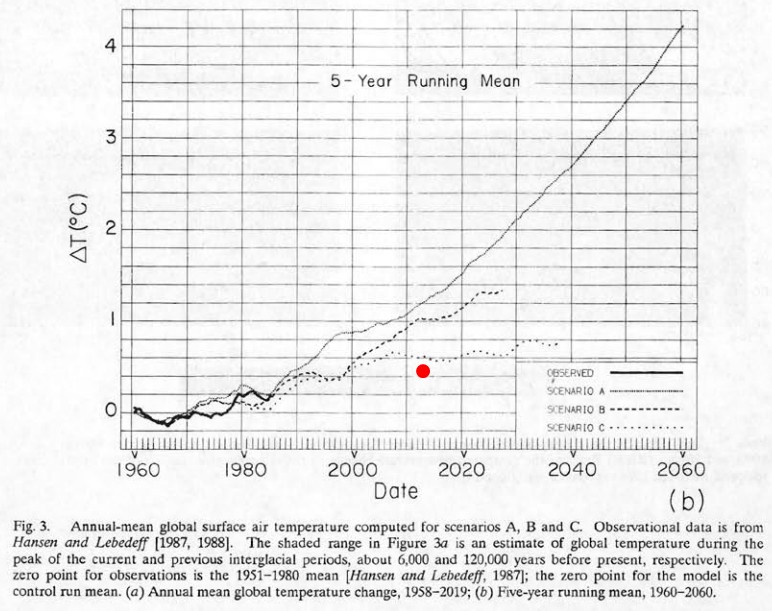
According to Hansen, global temperatures dropped in July to 0.47 – the lowest level since March, and far below Hansen’s zero emissions after 2000 scenario C
Disrupting the Borg is expensive and time consuming!
Google Search
-
Recent Posts
- Gaslighting 1924
- “Why Do You Resist?”
- Climate Attribution Model
- Fact Checking NASA
- Fact Checking Grok
- Fact Checking The New York Times
- New Visitech Features
- Ice-Free Arctic By 2014
- Debt-Free US Treasury Forecast
- Analyzing Big City Crime (Part 2)
- Analyzing Big City Crime
- UK Migration Caused By Global Warming
- Climate Attribution In Greece
- “Brown: ’50 days to save world'”
- The Catastrophic Influence of Bovine Methane Emissions on Extraterrestrial Climate Patterns
- Posting On X
- Seventeen Years Of Fun
- The Importance Of Good Tools
- Temperature Shifts At Blue Hill, MA
- CO2²
- Time Of Observation Bias
- Climate Scamming For Profit
- Climate Scamming For Profit
- Back To The Future
- “records going back to 1961”
Recent Comments
- Bob G on Gaslighting 1924
- Bob G on Gaslighting 1924
- conrad ziefle on Gaslighting 1924
- Bob G on Gaslighting 1924
- Bob G on Gaslighting 1924
- arn on Gaslighting 1924
- conrad ziefle on Gaslighting 1924
- Gordon Vigurs on Gaslighting 1924
- conrad ziefle on Gaslighting 1924
- Robertvd on Gaslighting 1924


And the band played on…
Ha Ha , just pitched another fine looking barrel of wine . About mid December should see me bottling it providing Lord willing I’m still amongst the living on earth . So when those cold winter nights are happening I’ll be able to enjoy a warm fire and a couple of glasses of peach wine. But I won’t waste a drop of it toasting the demise of the agw crowd . It’s a simple recipe , 300 pounds of nice windfall peaches 150 pounds sugar enough water to bring the level up to about the 60 gallon mark ( is ok if you have a little more it just means more to drink ha ha ) you do the standard proccess for making wine from there on and should be ready to bottle in December . This recipe will make the best wine most people have ever had . After the proccess is complete you will end up with around 50 gallons finished product and will drink quite a bit as the proccess works through . I wonder what the wackjob agw crowd will be screaming about in December but I don’t wonder very much as listening to them is kind of like visiting the lunatic asylum it just makes you sad about the waste of minds .
Another thing which is not generally known, is that the global temperature anomaly for GISS/NCDC/HADCRUT3/UAH/RSS for 2011 and 2012 so far, are all below the IPCC AR4 “COMMITMENT” scenario mean anomaly projection, which assumed zero growth in “greenhouse gas” emissions since 2000.
In other words, global temperature is behaving as if there had been zero growth in “greenhouse gas” emissions since 2000.
This looks like a job for… Adjustment Man!!
Somehow Schmidt still says that Hansen’s predictions are good, although closer to B than A.
I don’t get where he and Jimmy are coming from.
I think it takes a corrupt and confused mind to follow the thought patterns of the warmists , and like that guy corizine who oversaw the rape of MF Global they seem to be getting away with the money
You guys do realize that one month (or even one year) doesn’t indicate much, don’t you? The last available 5-year mean is about .54 C.
You do realize that temperatures are well below Hansen’s no emissions scenario C?
You do realize that GISS has been trending below scenario C for decades.
http://stevengoddard.wordpress.com/2012/06/14/temperatures-trending-below-hansens-zero-emissions-scenario-for-168-months-in-a-row/
Steve, you obviously cherry picked that month!/sarc.
Lol, even the heavily manipulated GISS is colder than Hansen predicted!! Hahaha, too funny!
I’ve always been intrigued how GISS arrive at their temperature records. If you check their map from 1900-2011 there has only been an increase of 0.05C for the past 110 years.
http://data.giss.nasa.gov/cgi-bin/gistemp/do_nmap.py?year_last=2012&month_last=7&sat=4&sst=1&type=anoms&mean_gen=0112&year1=1900&year2=2011&base1=1951&base2=1980&radius=1200&pol=reg
But their map from 2006-2011 shows an increase of 0.52C of 5 years when it is supposed to be cooling.
http://data.giss.nasa.gov/cgi-bin/gistemp/do_nmap.py?year_last=2012&month_last=7&sat=4&sst=1&type=anoms&mean_gen=07&year1=2006&year2=2011&base1=1951&base2=1980&radius=1200&pol=reg
Maybe I am interpreting them incorrectly.
I interpret the first map as showing that the mean anomaly for 1900 to 2011 is 0.05c above 1951-80 and the second one as showing that the mean anomaly for 2006 to 2011 is 0.52c above 1951-80.
Since 50 years of the period 1900 to 2011 is prior to 1951-80, I don’t think it is possible to interpret the first map as showing an increase of 0.05c over the last 110 years.
Got it. Thanks, Ray.