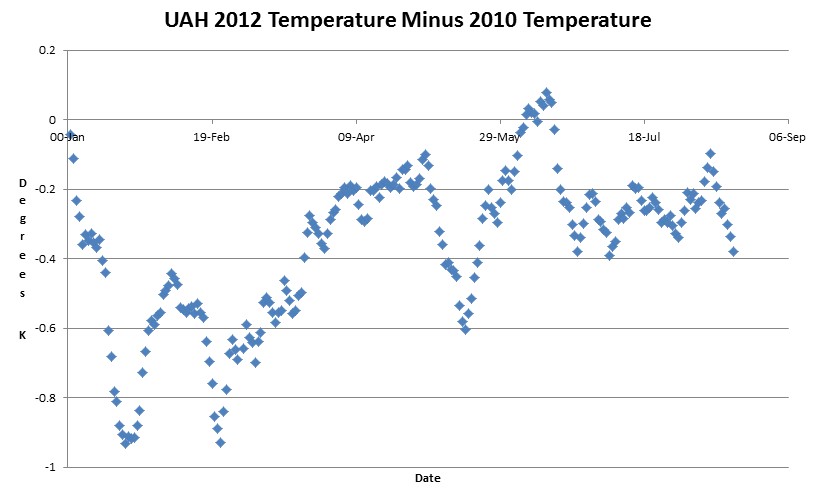
The world’s top climate experts said that an El Nino would make 2012 the hottest year ever.
The El Nino came, and 2012 has been colder than 2010 every day except for nine days – averaging 0.36 degrees below 2010.
discover.itsc.uah.edu/amsutemps/data/amsu_daily_85N85S_ch05.r002.txt
Thank you climate experts for being completely incompetent about the climate.


In Sept. 2009, the UKMO predicted that “about half” of the years from 2010 to 2015 would be warmer than the warmest year on record, which according to HadCRUT3 was 1998 with an anomaly of 0.517c, without actually specifying which half.
In January 2012, they forecasted that the 2012 anomaly would be 0.48c, while according to their figures the actual was 0.326c at the end of June (although I make it 0.357c).
In order for a the figure of 0.48c to be correct, the figure for the remainder of the year would have to average 0.6c.
So that’s 3 down and 3 to go as far as that prediction is concerned.
Having said that, in January they were changing their tune slightly by saying 2005 was the previous warmest year, according to the WMO average, even though not according to their own HadCRUT3 figures, so the fact that 2010 was warmer than 2005 using the WMO average, meant that they had been 1 warmer year.
I expect them to continue “cherry picking”, until they find a measure by which their prediction proves correct.
We will adjust the data to make sure that this year’s adjusted data is even warmer than last year’s adjusted data.
2010 was not the warmest year on record according to Hadcrut3, but was according to GISSTEMP.
So what did the climate scientists do to explain this anomaly?
1. The folks at NASA hid this inconvenient fact on a graph comparing four different temperature series.
http://manicbeancounter.com/2011/04/05/nasa-excludes-an-inconvenient-figure-on-2010-temperatures/
2. Later HADCRUT4 was introduced, which used the same techniques of smearing extreme temperatures from a few Arctic Stations (including some pretty dodgy figures for Reykjavík) over a much larger area.
HadCRUT3 is a joint effort between the UKMO and C.R.U. , but due to different methods of calculating the annual figures they can’t even agree on the same figures.
In the case of UKMO, the latest files show 1998 as 0.517c, 2005 as 0.474c and 2010 as 0.499c, whereas C.R.U. have them as 0.548c, 0.482c and 0.478c.
Clearly both have 1998 as the warmest, but the MO has 2010 as warmer than 2005.
The UKMO HadCRUT4 file has 1998 at 0.52c, and both 2005 and 2010 at 0.53c.
The C.R.U. site doesn’t seem to have access to HadCRUT4, so I don’t know if their figures are the same.
It would obviously suit the UKMO/CRU to retrospectively say that 1998 wasn’t the warmest after all, since that changes the short-term trends.
We are not even in an El Nino yet. It requires a three month moving average over the temp threshold to extend over 5 months. It will not be an official El Nino until January 2013 if temperatures develop as expected. Redo your chart for 2013 next year. The plot in this post is worthless.
Are you joking? I’m not the one who made the predictions.
Hard to believe it has been almost 26 years since October, 1986. (Just yanking your chain.)
Hey, it was a bad hop….
Yea it was. Didn’t take away from a great career.
I’m waiting for David Appell’s usual asinine comment that none of this matters because thousands of scientists cannot be wrong about the greenhouse effect. 😉
When did the El Nino come?
And you are using raw UAH data; note their own caveat: “The global-average data displayed on this page have only limited quality control, can undergo unannounced changes, and so should only be used as a general guide.”
http://discover.itsc.uah.edu/amsutemps/caveat.html
In fact, their lower troposphere processed results show that, year-to-date, 2012 (globally) is slightly warmer than 2011 (globally).
David,
Am I the person who made the if El Nino -> hottest year ever forecast?
Why don’t you talk to John Cook and ask him why did?
I don’t know about any forecast — I’m questioning your “an El Nino came.” It hasn’t (yet):
http://www.longpaddock.qld.gov.au/seasonalclimateoutlook/qccceclimatestatement/2012/20120712.html
You are so out of it ….
The updated (June-July) MEI registers at +1.14, a moderate increase of +0.24 that is the sixth such monthly increase since January 2012. The current rank is the 7th largest value for this season, well above the ‘moderate’ El Ni?o ranking threshold.
http://www.esrl.noaa.gov/psd/enso/mei/
That’s only one person’s interpretation. Further down he writes, “In its latest update (July 5th, 2012), an El Niño watch is declared with the potential for it to become reality in the next few months. This is still more conservative than my own viewpoint, but shaped by the lag of the Niño 3.4 region to develop significant positive anomalies.”
Actually I don’t know if anyone has looked at the latest POAMA dynamical model forecast. The ensemble mean is now predicting that the forming El Nino will fade out and go back to neutral. Interesting.
http://www.bom.gov.au/climate/poama2.4/poama.shtml#IOD
A year in which an El Nino is forming might be (at present) slightly warmer than a La Nina year… Obviously, we’re all going to die.