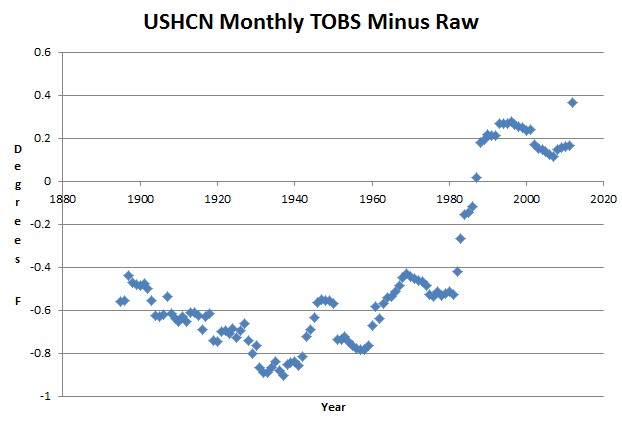
USHCN makes a huge TOBS adjustment in Ohio between 1979 and 1988, as seen below.
The justification for this is that they claim people in Ohio switched from reading temperatures in the afternoon, to reading them in the morning. That would theoretically push measured temperatures progressively down from 1979 to 1988.
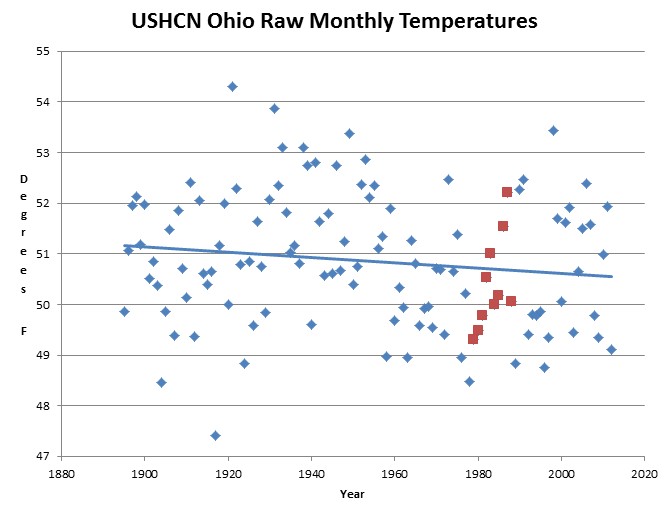
The Ohio raw data does not provide any support for the TOBS theory. In the middle of a long term cooling trend, measured temperatures rose very quickly from 1979 to 1988 – shown in red below. In fact, the thermometers reported the steepest temperature rise in Ohio history.
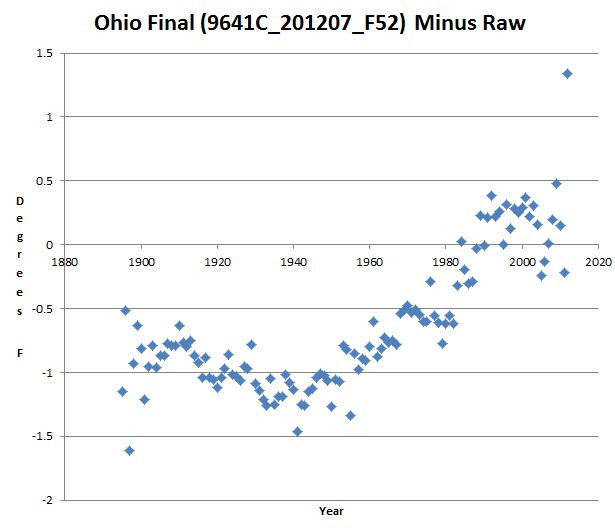
But it gets worse. The final adjustments are almost three degrees
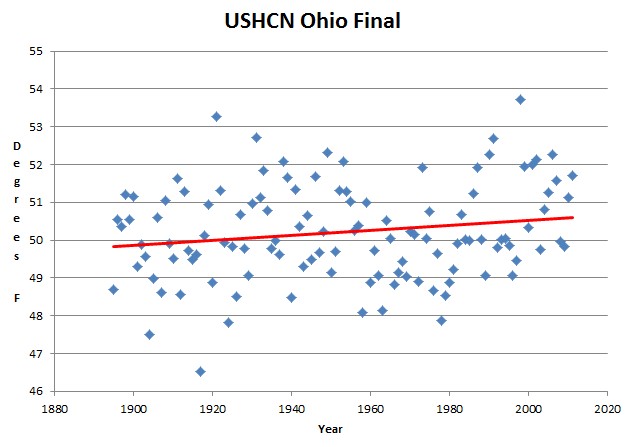
By the time USHCN is done adjusting, they have created a warming trend – which 127 years of Ohio thermometers never saw.


Holy crap – three degrees?? Do you have links to the datasets or did they already yank the incriminating numbers from the govt. servers?
Steve,
Do you have a link for state-by-state final adjusted temps, either monthly or annual? I already have the state-by-state raw daily temps from one of your other posts. Thanks!
ftp://ftp.ncdc.noaa.gov/pub/data/ushcn/v2/monthly
Thank you!