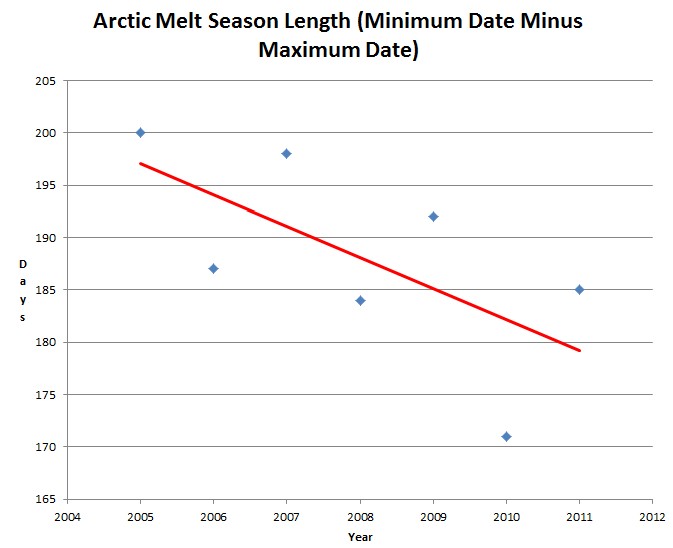
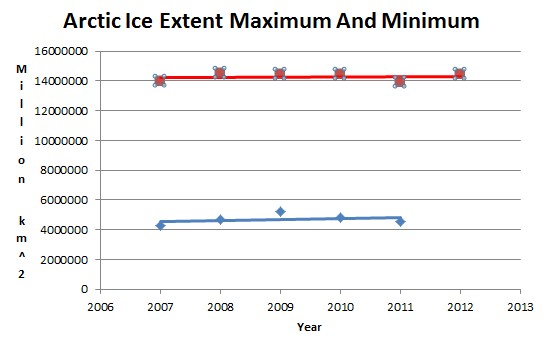
Melt season length is getting sharply shorter. Since 2005, the Arctic melt season length has dropped by almost twenty days.
Disrupting the Borg is expensive and time consuming!
Google Search
-
Recent Posts
- Gaslighting 1924
- “Why Do You Resist?”
- Climate Attribution Model
- Fact Checking NASA
- Fact Checking Grok
- Fact Checking The New York Times
- New Visitech Features
- Ice-Free Arctic By 2014
- Debt-Free US Treasury Forecast
- Analyzing Big City Crime (Part 2)
- Analyzing Big City Crime
- UK Migration Caused By Global Warming
- Climate Attribution In Greece
- “Brown: ’50 days to save world'”
- The Catastrophic Influence of Bovine Methane Emissions on Extraterrestrial Climate Patterns
- Posting On X
- Seventeen Years Of Fun
- The Importance Of Good Tools
- Temperature Shifts At Blue Hill, MA
- CO2²
- Time Of Observation Bias
- Climate Scamming For Profit
- Climate Scamming For Profit
- Back To The Future
- “records going back to 1961”
Recent Comments
- Bob G on Gaslighting 1924
- Bob G on Gaslighting 1924
- conrad ziefle on Gaslighting 1924
- Bob G on Gaslighting 1924
- Bob G on Gaslighting 1924
- arn on Gaslighting 1924
- conrad ziefle on Gaslighting 1924
- Gordon Vigurs on Gaslighting 1924
- conrad ziefle on Gaslighting 1924
- Robertvd on Gaslighting 1924


Still missing your date with the optometrist?
(Our bet is running alteady).
no comment is a comment, too.
I wrote an article explaining why the experts are wrong and an ice-free arctic is impossible, and you got fixated the exact location of a red dot. Is it a treatable condition you suffer from?
here the Max trendline (which is horsefeathers anyway): y = -22641x + 1E+07
Hi Steven,
agian cought refining the grphs and data you psot?!?!
One thing we can count on is change , the ice will be what it will be and I’ll accept and adapt to what nature brings . The ant who prepares usually survives . I could handle a lot more co2 and warm ( although I’m pretty sure co2 lags warm ) easier than I can handle cold . My gardens are producing very well this year . I believe this year is close to what I think of as normal although maybe a little cooler as crops seem to be about a week behind some of the past years but earlier by far than last year. You folks that live the fast paced city life chaseing the dollar are missing some of lifes best offerings . Our winter squash are sizing well and we have five varieties to store for the winter this year . Baked squash , squash soup with garlic and onions , squash and venison what blessings . If you are looking for squash that will keep all winter then delicata is the first choice as it will store through the winter clear to august if need be as long as you have a cool dry storage room. It is very sweet and tasty even when stored for many months. Well it will be interesting to see what the ice extent minimum reaches , as long as we get the truth about it.
I think the key point is that nothing is changing
Yeap,
still the same old thing:
Steven does not recognize any changes.
Not that they weren’t there:
http://arctic-roos.org/observations/satellite-data/sea-ice/observation_images/ssmi_range_ice-ext.png
or here:
http://wp.me/P7y4l-5Kc
This might help, Stven
http://tinyurl.com/brabsz8
$1000 on a record minimum. Time to stand by your belief system
I did offer you a 1,000,000$ bet that your “red dot” is wrong.
For the minimum extend: since I consider it as gambling (50:50) I did limit my bet to 50$.
So stop bullshitting on betting when the bet is already set.
Or should i go higher with my bet that you’d be able to pay your optometrist (in case you’d win)?!?!
If you believed any of your bullshit, you would be happy to up the ante on the record minimum
An excellent graphical representation of the greenhouse effect.
Just look at all that extra warming.