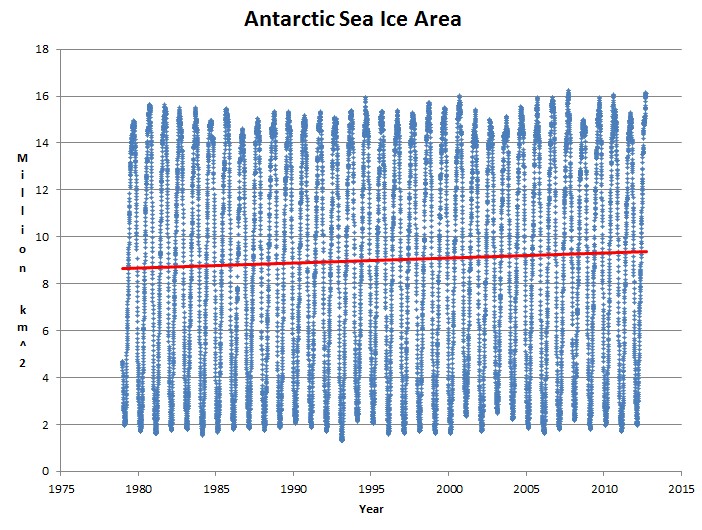
Antarctica gained 140,000 km² of ice overnight, to reach the sixth highest daily area ever recorded. Another day like today, and tomorrow will break the all-time record for most sea ice ever measured at either pole.
arctic.atmos.uiuc.edu/cryosphere/timeseries.south.anom.1979-2008
Climate experts tell us that the poles are melting down and that penguins are in danger of extinction due to missing ice.
arctic.atmos.uiuc.edu/cryosphere/timeseries.south.anom.1979-2008


Looks like we’ll have enough ice for the toast… how many ice cubes is that for each human?
Depends on whether your glass is half full or half empty ; – )
Manhattans are served straight up, no ice.
Penguins are pissed and turning violent with the sea ice gain and ice mass balance increase in the Antarctic.
http://www.wimp.com/cutepenguins/
Where is Batman when ya need him? 😆
Looks like Polar Bears are safe now!!!!!!
The alarmists still insist that the ice shelf will collapse and take all of the penguins with it. They will certainly not let the truth get in the way of their long standing fairy tales.
Isn’t that the plot of the film Ice Age: Continental Drift ?
Well, here’s the real deal.
The Good Guys, the People in the Inner Earth through millennia of keeping apart, have developed ultra high tech, and Love and Peace, and want NOTHING to do with the Outside Warring countries. It’s a beautiful world int here, with a wealth of Natural Resources, and various Races, cooperating, working together.
The Warring Powers are scared to death of the Inner Earth Civilizations, because these have MORE Power than the Outside. But the Inner Earth People, humans same as us, want NOTHING to do with the Outside, no matter what side.
The Warring Countries want in, – have been trying to get in, by hook or crook, even sneaking in with subs, but no cigar. The Outside powers want the the ultra tech, so the Outside developed HAARP, to screw up the atmosphere and melt the ice caps over the Inner Earth entrances.
The ice has been melting this way, but the Inner Earth people, have been freezing it up again, to prevent the Warring Powers access.
There’s the deal!
Smeagol returns
An electronically phased shortwave planar array capable of creating tropospheric vortexes would need to have an area of 1000 X 1200 miles, and I don’t know of any being that large (simple physics)…
Ah, but this is all first year ice; it will just suddenly melt away (© NSIDC).
I’m sorry to ask but is that graph based on fully Hansenated figures or has it yet to be ‘adjusted’?
/sarc
I can see it all now . .The carbonistas will start screaming next that the ice forming so fast in the south is caused by global warming (and if we dont start paying special AGW taxes, blah blah) and that the increase of ice mass vs the lessening of icemass in the north (arctic) will cause the earths crust to spin / shift . . .and we’ll all either be snap frozen or suffer from sunburn / heat related issues, depending where you were / are.
The warmists should be more concerned I believe with stopping the pollution of streams and oceans, and all the shit that gets buried (usually in some poor country or around areas where there are poor / people of colour etc) and the
There is an upward trend, but that regression line has way too high of a slope based on the data you posted. It appears someone eyeballed a line rather than doing an actual regression. I don’t believe in AGW, and I hate to give them any ammo, but intellectual honesty is a must when you’re up against those without it.
Kelly, I notice that there is a significant “tail”, for lack of a better term, at the beginning of the data. The data start well before the bottom of a trough. But they end up very close to a peak, and there is a distinct lack of symmetry.
Perhaps all of those data should not have been plotted, but I don’t believe that Steven just eyeballed a line. From his past postings, he clearly has software to do the regression (for example, Excel), so there is no reason to think he hasn’t done it. The most reasonable explanation is the lack of symmetry in the data points. I am sure the warmist cynics would say this is cherry picking, but the data apparently go back to 1979, so that means he’s just pulling all the data. Perhaps he should have cut off that tail, but as you observed, it still clearly goes up anyway without the tail.
Cool – Steve!
Hey Steve, love your blog. You give strength to your fellow travellers. Thank you.
http://www.natice.noaa.gov/new_look/products/ice_extent_graphs/antarctic_daily_ice_extent.html
22.47!
Instead of “All” months, Choose September in the drop down on the right.
Check it out…
Ben, it looks like we lost about 20 million k on 0/11? Bit odd.
Pesky decimal point fell in the wrong spot. Or there is a gigantic block of sea ice heading north after breaking off.
Acc to the NSIDC, sea ice trends in the polar regions, 1979 to 2008, were
Arctic: Significant decrease of 4.1% (~500,000 km²; 193,000 mi²) per decade.
Antarctic: Small increase of 0.9% (~100,000 km²; 42,000 mi²) per decade.
So, how is the increase of sea ice at the S Pole of any relevance, please?
So you are arguing that Arctic ice loss has been greater than Antarctic ice gain?
Global sea ice area has above normal almost all year.