Disrupting the Borg is expensive and time consuming!
Google Search
-
Recent Posts
- Analyzing The Western Water Crisis
- Gaslighting 1924
- “Why Do You Resist?”
- Climate Attribution Model
- Fact Checking NASA
- Fact Checking Grok
- Fact Checking The New York Times
- New Visitech Features
- Ice-Free Arctic By 2014
- Debt-Free US Treasury Forecast
- Analyzing Big City Crime (Part 2)
- Analyzing Big City Crime
- UK Migration Caused By Global Warming
- Climate Attribution In Greece
- “Brown: ’50 days to save world'”
- The Catastrophic Influence of Bovine Methane Emissions on Extraterrestrial Climate Patterns
- Posting On X
- Seventeen Years Of Fun
- The Importance Of Good Tools
- Temperature Shifts At Blue Hill, MA
- CO2²
- Time Of Observation Bias
- Climate Scamming For Profit
- Climate Scamming For Profit
- Back To The Future
Recent Comments
- Bob G on Analyzing The Western Water Crisis
- Bob G on Analyzing The Western Water Crisis
- arn on Analyzing The Western Water Crisis
- Scott Allen on Analyzing The Western Water Crisis
- conrad ziefle on Analyzing The Western Water Crisis
- conrad ziefle on Analyzing The Western Water Crisis
- Bob G on Analyzing The Western Water Crisis
- Bob G on Analyzing The Western Water Crisis
- Bob G on Gaslighting 1924
- Hank Phillips on Climate Attribution Model


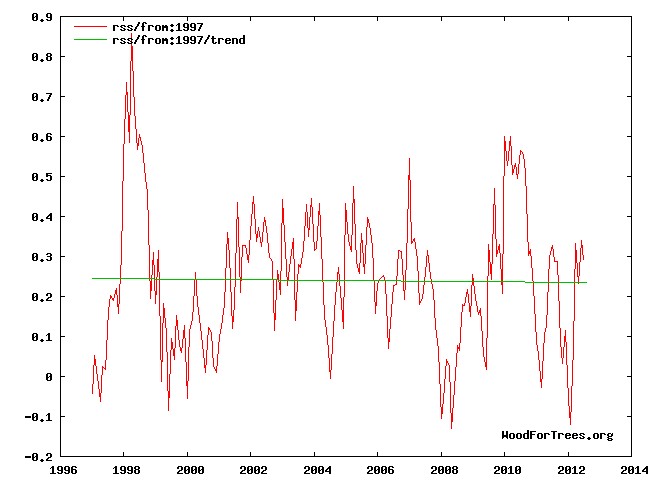
Every time I cite the rss satellite data as evidence of the lack of warming in recent years, I get doomsday fanatics jumping all over me that I should be using UAH data. I should be because of what Spencer said here: http://www.drroyspencer.com/2011/07/more-on-the-divergence-between-uah-and-rss-global-temperatures/
UAH still shows a slight trend.
Oddly, only UAH shows a positive trend throughout the record. About 2001, it is insignificant, but that is the lowest.
RSS is negative, though insignificant, from 1997.
The other data sources go to zero around 2001.
In the BAMS “State of The Climate, 2008” IPCC climate models were tested against temperature on a decadal basis for 10 years. The scientists testing the models state:
“Near-zero and even negative trends are common for intervals of a decade or less in the simulations, due to the model’s internal climate variability. The simulations rule out (at the
95% level) zero trends for intervals of 15 yr or more, suggesting that an observed absence of warming of this duration is needed to create a discrepancy with the expected present-day warming rate. ”
We are now at 15.66 years of near zero/negative trend depending on temperature data used. If this isn’t grounds for a debate as to the accuracy of IPCC climate models then I’m at a loss to understand why science is even involved in climate change.
Baring in mind that computer models have never been a good method of proving a theory. The variation in different model’s output, and their lack of correlation with reality, is not surprising.
Bloody murder alarmists prefer James Hansen data, you know, the pretend warming trend data set.
i.e., GISTemp
You even started at a low of La Nina before the 1998 Super El Nino! Why not go from Ell Nino peak to El Nino peak, 1998 to 2012. It would be fair and it would show even more cooling.
http://www.woodfortrees.org/plot/rss/from:1998.2/plot/rss/from:1998.2/trend
And something odd is happening with the El Nino forming in the pacific right now. Cold water is accumulating off the coast of South America and it seems to be interacting with below average SST’s in the North Atlantic as well. Could be why some dynamical models are showing that the El Nino is going to fad away. Whatever happens will be interesting to watch.
Meant to write North Pacific…
It also looks like cool water is just starting to forming under the cooling equatorial water.
http://www.bom.gov.au/climate/enso/sub_surf_mon.gif
Thanks! Also keep an eye on:
http://www.ecmwf.int/products/forecasts/d/charts/oras4/reanalysis/sections/xzmaps/1m!1m!201203!Anomaly!Temperature!/
Although I suspect you do anyway…