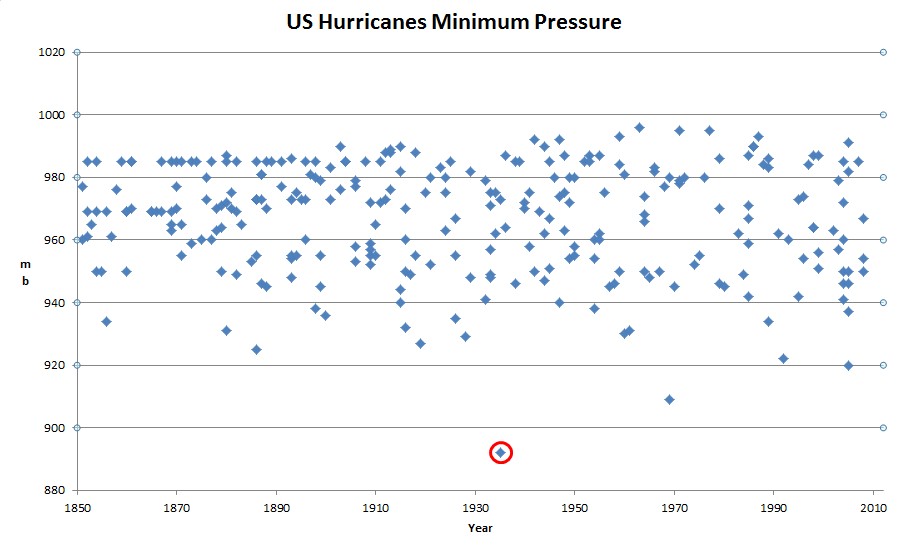
The 1935 Labor Day Hurricane had a minimum pressure of 892 millibars, by far the lowest on record for landfalling US hurricanes.
Disrupting the Borg is expensive and time consuming!
Google Search
-
Recent Posts
- “Why Do You Resist?”
- Climate Attribution Model
- Fact Checking NASA
- Fact Checking Grok
- Fact Checking The New York Times
- New Visitech Features
- Ice-Free Arctic By 2014
- Debt-Free US Treasury Forecast
- Analyzing Big City Crime (Part 2)
- Analyzing Big City Crime
- UK Migration Caused By Global Warming
- Climate Attribution In Greece
- “Brown: ’50 days to save world'”
- The Catastrophic Influence of Bovine Methane Emissions on Extraterrestrial Climate Patterns
- Posting On X
- Seventeen Years Of Fun
- The Importance Of Good Tools
- Temperature Shifts At Blue Hill, MA
- CO2²
- Time Of Observation Bias
- Climate Scamming For Profit
- Climate Scamming For Profit
- Back To The Future
- “records going back to 1961”
- Analyzing Rainfall At Asheville
Recent Comments
- arn on Climate Attribution Model
- Bob G on Climate Attribution Model
- Bob G on Climate Attribution Model
- Bob G on “Why Do You Resist?”
- Gerald Machnee on Fact Checking The New York Times
- Gerald Machnee on Climate Attribution Model
- Gerald Machnee on “Why Do You Resist?”
- arn on Climate Attribution Model
- arn on Climate Attribution Model
- Gordon Vigurs on Climate Attribution Model


You would say that perhaps the pressures of landfalling hurricanes should be “adjusted” down for the old days. That is because the network of stations was less extensive in the old days, nor did we have aircraft, satellites and radar closely monitoring the storms.
Cherry pick much? If you went by total overall pressure, you would have seen that Wilma in 2005 was much lower than the 1935 Labor Day Hurricane, and so was Gilbert in 1988.
You also ignored the pacific basin, which has had several storms below 890 or even 880mb.
Are you a complete moron? Is there some part of “landfalling” and following html links which isn’t clear to you?
This is why I am spamming a lot of people, because your side is stupider than crap.
Anything in the old days should be adjusted up considering what you say, not down. Lack of observation compared to the present should be taken into account. Now of course landfalling hurricanes would still be spotted but it is true storms well off shore and the time spent at more than a certain strength are spotted more easily now.
It’s like sunspots, you have to take into account this. they do with sunspots, not so much with storms.
Andy
If you separate the atlantic hurricanes and tropical storms data into decades (1851-1860, 1861-1870, etc.), you will find the average strength of a strong hurricane (category 3, 4, or 5) also peaked in the 1930’s (1931-1940), at 4.167 (whereas for 2001-2010, for example, it was 3.868, even though there were more than twice as many strong hurricanes in that decade as there were in the ’30’s). Category 5 hurricanes don’t even appear in the records until 1924 (which implies a change in human record-keeping, not an actual increase in storm strength), and then they average one such category 5 every 2.6 years, or about 4 per decade; in that context, 2005 was an exceptional year, when there were four category 5’s, in one year. If you look at all atlantic tropical storms and hurricanes, the average strength per storm (taking a tropical storm as a category 0) peaked in the 1940’s, at 1.469 (whereas, for example, in 1931-40 it was 1.174, and in 2001-2010, it was 1.277). I have thought about doing a post on the hurricane and tropical storm data from 1851, but frankly, I am no expert on these storms, and anyone who has any real interest in it, or is at all worried about the “trends”, should do it themselves, using the above link to find the data. That should cure anyone of their alarm on the subject (if they are honest, and minimally competent about taking simple averages), and in the easiest and most convincing way possible for them.