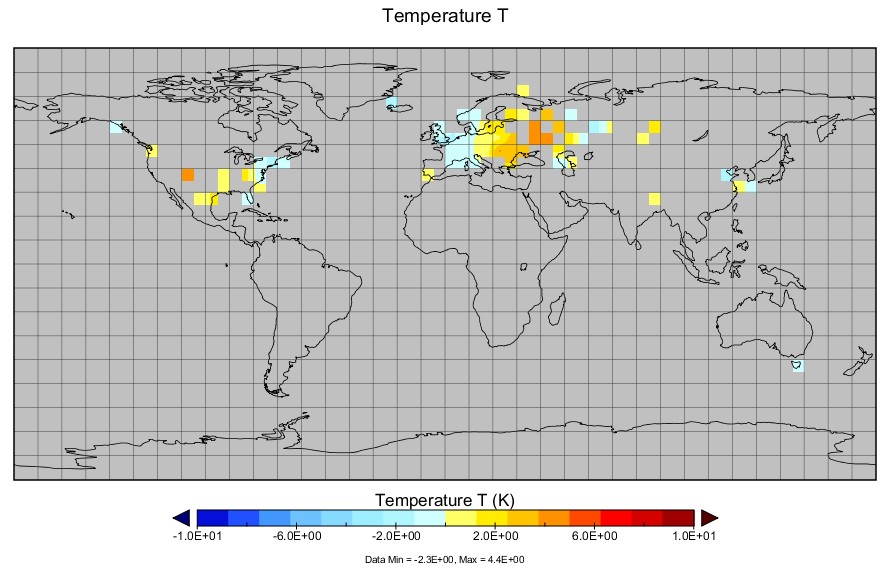
CRUTEM3v – August 1850. Phil had one thermometer record for the entire southern hemisphere, and was able to precisely calculate the hemispheric mean temperature anomaly of -1.182
Disrupting the Borg is expensive and time consuming!
Google Search
-
Recent Posts
- Analyzing The Western Water Crisis
- Gaslighting 1924
- “Why Do You Resist?”
- Climate Attribution Model
- Fact Checking NASA
- Fact Checking Grok
- Fact Checking The New York Times
- New Visitech Features
- Ice-Free Arctic By 2014
- Debt-Free US Treasury Forecast
- Analyzing Big City Crime (Part 2)
- Analyzing Big City Crime
- UK Migration Caused By Global Warming
- Climate Attribution In Greece
- “Brown: ’50 days to save world'”
- The Catastrophic Influence of Bovine Methane Emissions on Extraterrestrial Climate Patterns
- Posting On X
- Seventeen Years Of Fun
- The Importance Of Good Tools
- Temperature Shifts At Blue Hill, MA
- CO2²
- Time Of Observation Bias
- Climate Scamming For Profit
- Climate Scamming For Profit
- Back To The Future
Recent Comments
- Bob G on Analyzing The Western Water Crisis
- Bob G on Analyzing The Western Water Crisis
- arn on Analyzing The Western Water Crisis
- Scott Allen on Analyzing The Western Water Crisis
- conrad ziefle on Analyzing The Western Water Crisis
- conrad ziefle on Analyzing The Western Water Crisis
- Bob G on Analyzing The Western Water Crisis
- Bob G on Analyzing The Western Water Crisis
- Bob G on Gaslighting 1924
- Hank Phillips on Climate Attribution Model


It would be amusing to plot the subsequent global temperature using data from only the same grid squares as used in the 1850 plot.
Yeah but Steve Mosher says this is how science is done and he trusts the scientists.
Backed by someone esle that post here! 😆
Else, LMAO!
I fear they’ve developed DRB Syndrome (dirty rotten bastard).
Phil’s buddy Trenberth ran quickly from Stratwarm studies a few years ago and someone needs to ask him why?
This is the same dead-certain teleconnection approach used by the tree-ring fraudsters to estimate global or NH temperatures in centuries past based on a few bristle cone pines in one location in the US Southwest, and assuming stationarity of the relationship between ring width or density and temperature.
Its BAU ‘climate science.’ What’s the problem?
It shows up how poor a technique it is to average temperatures over a geographical area. The temperature of one place is that place’s temperature only. It can not be smeared across a region, as currently done by Hansen et al, to try and give the globe an average temperature, when using fewer and fewer weather stations.
The full file gives the 95% confidence range for the August 1850 figure as between +0.323 and -2.911C.
http://www.metoffice.gov.uk/hadobs/crutem3/diagnostics/hemispheric/southern/monthly
Stop being an idiot.
Confidence range to 3 sig figs… That makes this metmess even worse!
LOL!!!!
You might as well assert you are 95% confident you have no idea what the temperature was. 😉