www.ijis.iarc.uaf.edu/seaice/extent/plot.csv
We have now passed the date of the first coming of the holy Arctic minimum (9/24/2007) and as everyone can plainly see, the Arctic is doomed.
The August 2012 winter-like storm which broke up the ice and brought warm water to the surface has now defined the future of mankind. We will all certainly die in a fiery hell as a result of that storm.


These posts show why we are talking about the Arctic. Warmists and skeptics look at the world through very different lenses. Warmists see positive feedbacks and tipping points everywhere, and the Arctic is one of their big ones. Skeptics see negative feedbacks characteristic of a climate system oscillating between stable states.
This year’s melt is exciting because maybe, just maybe, Nature is conducting an experiment in the Arctic from which we can learn. A step-change of 8% reduction of ice extent from the previous 2007 low presents an opportunity to test over the coming years how the climate responds: either accelerating the melting, or recovering the ice. Also, we shall see how the weather is impacted by more open water this year.
The “open water” will be frozen over in a few weeks. How could that affect the weather?
I don’t know the effect, but there is a warmist notion that the jet streams will be affected by this event. Let’s see if that happens.
By what event?
It is also though that the jet streams, influenced by solar activity, causes what we are witnessing. Chicken or egg?
See: Piers Corbyn
It looks more like a death slinky to me.
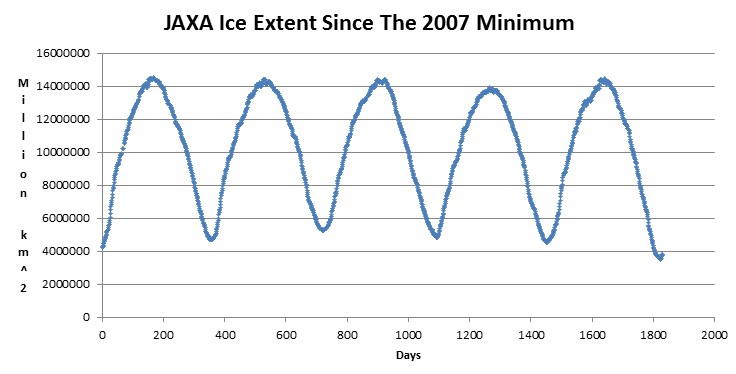
I am unclear how the included graph shows anything related to the title. How is the graph created? Do we know that much about past extent? ? ? ?
huh?
That 2000-year graph did not come from your 30-year data link. Pilot error.
What “2000-year graph”? I see Max-Min sea-ice extent plotted for 5 years.
You did know that it goes up and down every year right?
The graph originally said years rather than days on the x-axis
Oh, okay. I apologize to Kim Allen.
He is showing that it recovers every winter back to the same amount by surface area.
Hey Higley, yes, I think I understand why you ask, but if you look closer you will see that the graph is mislabeled. The “year” label should be “days”. This graph only shows the last five years, not the last 2000.
FYI Recent thoughts from JS.
http://www.youtube.com/watch?v=vwdnqWL1YkY
“There wasn’t any sort of, really amanzing weather pattern that was conducive to ice loss”
Pretty amazing statement. She knows there was a summer cyclone that NASA now says is the reason for the ice loss. Either she: Is incompetent, is lying, or doesn’t believe NASA.
Let’s all take a pick.
Perhaps she forgot what she posted here? http://stevengoddard.wordpress.com/2012/08/19/julienne-stroeve-explains-the-effects-of-the-winter-storm-which-hit-the-arctic-two-weeks-ago/
Yes, while participating in a GreenPeace junket, she just conveniently forgot:
“About last week’s storm
-Storm area 1 million square kilometers
-Wave height of 2 to 3 meters broke apart ice into smaller chunks, increasing surface area and thus melting
-Storm mixed fresh water at surface (from melted ice) with deeper warmer saltier water from below increasing melting rate
-Storm agitated water to depths of 500 meters (where water is much warmer) bringing it to surface increasing melt rate
-Low pressure of storm center sucked up water level by 0.3 meters, causing warm water to flow into Arctic Ocean from Pacific Ocean via Bering Strait and from Atlantic Ocean, increasing melting
-Storm rotation (counterclockwise) spread out ice over larger area and pushed ice towards open ocean (on Atlantic Ocean side)”
Julienne Stroeve NSIDC
Julienne seems to have memory issues, and this is not just a recent issue. She has forgotten all about natural variability. I have tried to jog her memory a few times, but then she seems to get distracted, and forgets to reply. Maybe she slipped on some nonexistent ice and hit her head.
Gator,
No memory loss….just advocacy science. Listen to the end of recording. It is cringeworthy. And no Jullienne, we do not need scientists to be better at connecting the dots about what they already think they know.
We need them to be scientists, not activists.
I’d give her 10 years before she goes from a cougar to a Bianca Jaguar!
Sundance, thanks for putting a valley-girl voice to her written psychobabble. It is pretty obvious to me she was an agenda driven activist all along. Didn’t hear her mention the word ‘Greenpeace’ at all in that friendly interview. Will she ever acknowledge that trip?
Transcription of 0:50 to 2:00 …
… and then finally does acknowledge the big August storm! This is what happens when you are pre-programmed. She was rattling off all the left-wing AGW talking points one after another and then tacked on that brief mention of the storm because she probably just remembered writing about so she had no choice but to double-back and cover it.
At approx 5:00 she is completely out of the closet, mouthing all the clichés to satisfy the climate alarmist reporter.
Agenda driven Science is not Science.
About 75% of sea ice in the Arctic melts (and reforms) annually. The additional sea ice loss this year represents approx. a 1% additional loss. What is the correlation between the jet stream and annual sea ice melts? I’m presuming that if a 1% change can make a difference, the other normal 75% variation must have a huge impact on the jet stream from month to month, surely?
Ah, my poor eyesight. I did not have my cheaters on and missed the “days” label on the x-axis.
“It’ll grow back, it’ll grow back…” 🙂