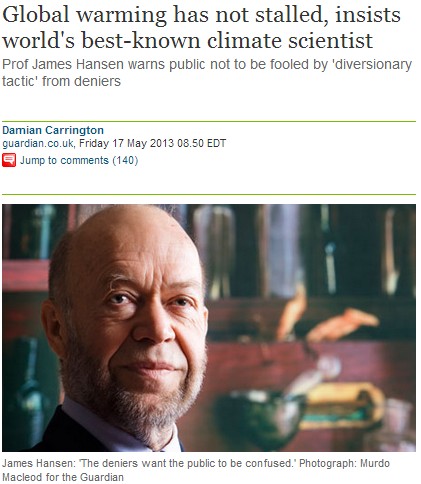
Prof Hansen, speaking to BBC Radio 4’s Today programme, rejected both arguments. “In the last decade it has warmed only a tenth of a degree compared to two-tenths of a degree in the preceeding decade
(Note that the Guardian writer doesn’t know how to spell “preceding.”)
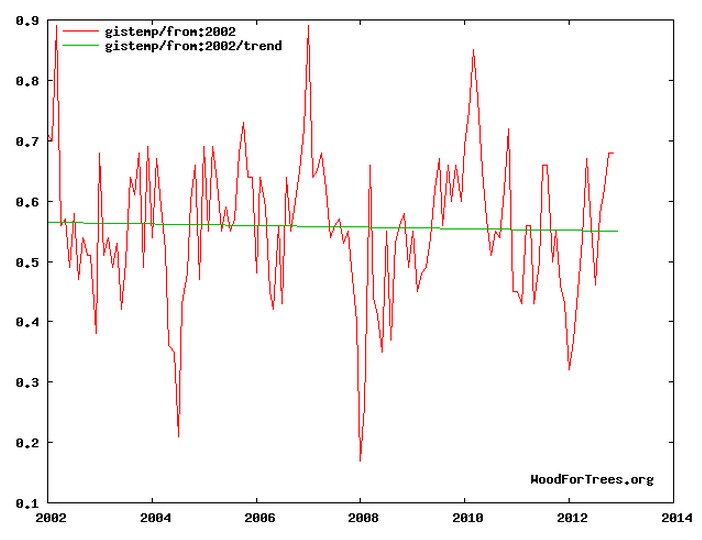
According to Hansen’s own data, there has been no warming over the last decade. Why is he lying to the BBC and its listeners?


He is trying to look like Gavin! 🙂
And Mikey! Three clones in a fucking scam…
Hansen, Mann and Schmidt are all resurrecting the Lenin facial hair. ‘Great’ minds think alike…
Also, it helps Josh create his cartoon caricature of the canonical climate scientist.
Hansen does not know what his own data shows! He heard about that on the news and thinks it is fabricated by the “Deniers”!
We don’t really know what Hansen was referring to when he quoted those figures.
He might have been referring to decadal averages but they don’t fit exactly.
If the BBC were a bit less trusting, they would have asked him to define precisely what he meant.
That’s half the problem. So many journalists are so lazy/biased these days that they don’t bother to question statements that fit in with their world view.
On the other hand, if Cameron or Farage had made some nebulous claim, they would have jumped all over them.
Over at the Guardian I simply reminded them that the astronomer in chief said that the oceans would boil and end up in the atmosphere. A Warmist cleverly replied that James Hansen knows that the oceans would not boil and end up in the atmosphere*&^%$#%^. I gave up with the poor chap.
You call that a beard? I didn’t know he was Amish.
LOL:
He’s ready to take his place as an Unholy Climate scientist preaching repentence to the wicked deniers for not believing his BS. 🙂
“Why is he lying to the BBC and its listeners?”
Because there is no truth detector, especially on the BBC.
Wow… If Jimmie “Death Trains” is the best climate “scientist”. AGW is worse Joke than we thought.
It’s even more than 10 years, Jimmy.
Your own figures show that there has been ZERO.ZERO warming since 1997!
http://notalotofpeopleknowthat.wordpress.com/2013/04/25/no-warming-since-1997a-better-way-to-show-it/
Or in other words compared to natural temperature fluctuations the actual temperature trend over decades is so minuscule that a year’s difference here or there alters the trend line.
Behold, the face of stupid.
Whoa! Don’t you all know it’s not nice to pick on the elderly who are suffering with Dementia.
I guess Megalomania with planet saving delusion disorder isn’t confusing the public enough.
How does Homer propose to bake ceramics or melt steel ?
Homer isn’t the only one having trouble with math…
http://washington.cbslocal.com/2013/05/17/obama-consoles-students-after-failing-to-answer-math-problem/
I understand the question was: “How much is 2 minus 1”. She could not answer.
American workforce of the future…?
that face scares me, its very creepy
The 10 year trend in GISS to December 2000 was 0.169c/decade and the 10 year trend to December 2010 was 0.148c/decade.
If you round the figures to a single decimal place, you get 0.2c and 0.1c
Could this be what Hansen was referring to?
Sorry, those are 15 year trends – back to the drawing board!
The correct figures for TEN year trends in GISS, for 1991-2000 and 2001-2010 are +0.238c/decade and +0.047c/decade respectively.
These are still similar to the 0.2c and 0.1c quoted by Hansen, although if you are rounding to 1 decimal place, it would be more correct to say 0.2c and 0.0c.
In fact the fall between the decades is more like 0.2c than the 0.1c quoted by Hansen.
Of course the latest 10 year trend, up to April 2013 is now negative.
So I think that unfortunately the BBC were effectively duped because they weren’t really aware of the real figures themselves.
Check your calendar The current year is 2013. 2010 was a hot year, and you are living in the past.
I am aware of that but I am trying to work out where Hansen has got his figures from.
Naturally, Hansen is probably “cherry picking” and he may well have used those two decades.
Actually, taking what he says literally, i.e. the “last decade” and the previous one, the figures are:
2003-2012 = -0.012c/decade
1993-2002 = +0.331c/decade
So a fall of about 0.34c/decade, rather than the 0.1c/decade he said.
What difference does it make? Hansen is spectacularly incompetent and a liar.