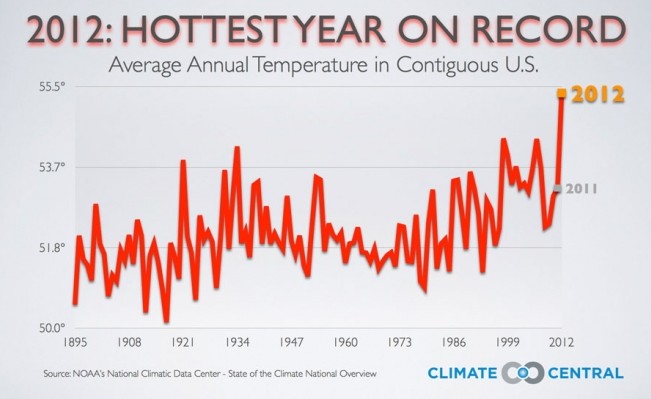
Climate Central released this graph, which proves that global warming is burning up the US.
NOAA: 2012 Hottest & 2nd-Most Extreme Year On Record | Climate Central
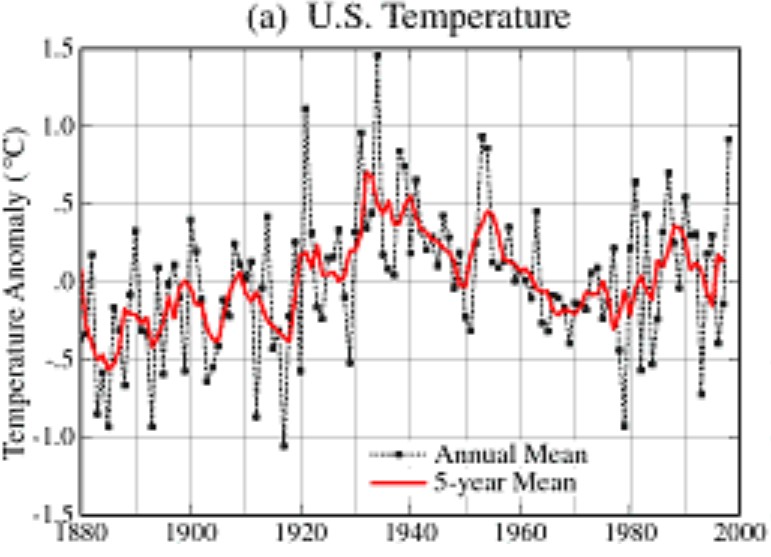
It looks very different from Hansen’s 1999 graph, which showed that the US has been cooling since the 1930s.
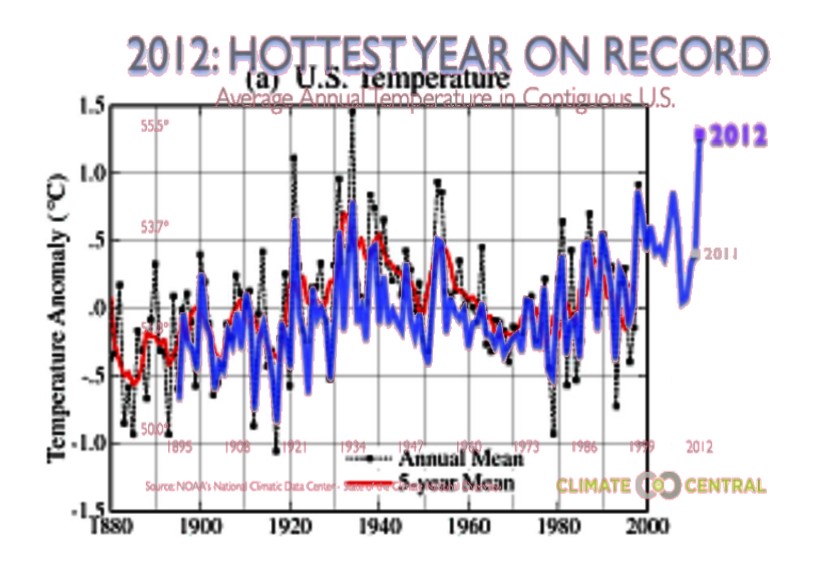
The graph below overlays the Climate Cheating Central graph on the Hansen graph, at the same scale and normalized to the 1980s and 1990s.
Impressive work! They knocked almost a full degree centigrade off of 1934.
An honest graph shows that there has been no warming since the 1930s, and that 2012 wasn’t the hottest year. But that isn’t what Climate Cheating Central is all about.


Is this being done simply for the benefit of “true believers” to keep their spirits up because of the mounting evidence which contradicts their religion? Otherwise, for smart people these people are very dumb. Stuff like this is what is killing them in the realm of public opinion. When you have DECADES of information which shows contradictions and outright lies then this has a way of undermining your credibility. These people truly live in their own bubble, don’t they? They think people won’t notice these outright lies and fabrications.
Someone needs to sue Hansen and NOAA.
It’s confirmation bias, bad science, self interest, and other factors like that. The world is full of people with cranky ideas or ideas that are borderline science. You can’t put these people in jail. You have to try to hold to account the people who wanted to believe their claims and didn’t do due diligence. Propaganda merchants spring to mind, i.e., “I’ve manipulated my process so that I ended up with 97% of all the world’s scientists supporting what I believe.”