Disrupting the Borg is expensive and time consuming!
Google Search
-
Recent Posts
- Gaslighting 1924
- “Why Do You Resist?”
- Climate Attribution Model
- Fact Checking NASA
- Fact Checking Grok
- Fact Checking The New York Times
- New Visitech Features
- Ice-Free Arctic By 2014
- Debt-Free US Treasury Forecast
- Analyzing Big City Crime (Part 2)
- Analyzing Big City Crime
- UK Migration Caused By Global Warming
- Climate Attribution In Greece
- “Brown: ’50 days to save world'”
- The Catastrophic Influence of Bovine Methane Emissions on Extraterrestrial Climate Patterns
- Posting On X
- Seventeen Years Of Fun
- The Importance Of Good Tools
- Temperature Shifts At Blue Hill, MA
- CO2²
- Time Of Observation Bias
- Climate Scamming For Profit
- Climate Scamming For Profit
- Back To The Future
- “records going back to 1961”
Recent Comments
- Bob G on Gaslighting 1924
- John Francis on “Why Do You Resist?”
- conrad ziefle on Gaslighting 1924
- Bob G on Gaslighting 1924
- Bob G on Gaslighting 1924
- Bob G on Gaslighting 1924
- conrad ziefle on Gaslighting 1924
- Bob G on Gaslighting 1924
- Bob G on Gaslighting 1924
- arn on Gaslighting 1924
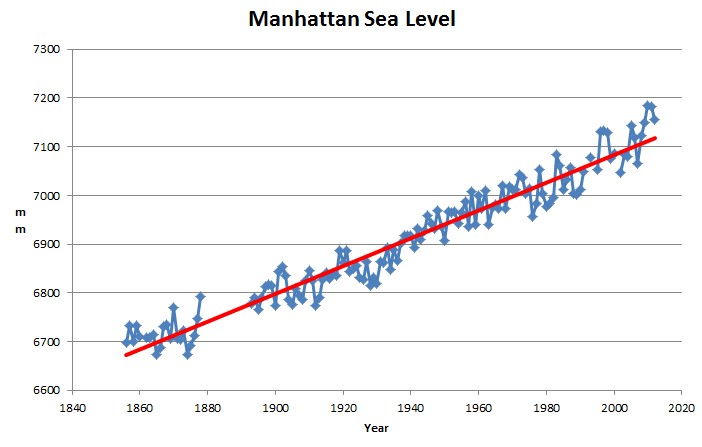
Climate Superstition Is A Threat Right Now, Not In The Distant Future
This entry was posted in Uncategorized. Bookmark the permalink.


They dont have to worry as the next glacial period shoild lower the oceans a 100 meters.
I’m sorry, I look at Kodiak Island, AK to see the state of sea levels:
Kodiak Island, Alaska 9457292
The mean sea level trend is -10.42 mm/year with a 95% confidence interval of +/- 1.33 mm/year based on monthly mean sea level data from 1975 to 2006 which is equivalent to a change of -3.42 feet in 100 years.
On the other side, we have Grand Isle, Louisiana “…The mean sea level trend is 9.24 mm/year with a 95% confidence interval of +/- 0.59 mm/year based on monthly mean sea level data from 1947 to 2006 which is equivalent to a change of 3.03 feet in 100 years…”
I think we may be able to find the tipping point.