Steve,
i am pleased to see that you have cited PIOMAS in one of your articles as does the NSDIC, NOAA, the US Navy and others do. What changed your mind? Why do you no longer think of them as “complete crap”?
Steve,
PIOMAS makes clear their data and methodology and they validate their findings with satellites, moorings and the US Navy. Why would I doubt them? Because you tell me to?
However, if you can provide evidence — and independent validation — to the contrary, then I will certainly take a look at it. Until that time, I have to go with PIOMAS.
Every simplistic model that predicts the climate will behave in a more or less linear fashion has been shown to be wrong. But you believe it, so that’s all that’s important. Enjoy.
Steve,
Well, I was a Lazarus but that was taken so I became “The Other One (T.O.O.), however, I have never been a Tony before. I understand that you also have a different name. Care to share?
So here we go again (happens every time ice INCREASES above AGW expectations)
CT is showing a huge fall in NH ice extent (up to date) http://arctic.atmos.uiuc.edu/cryosphere/IMAGES/seaice.recent.arctic.png
DMI is frozen but the old graph (up to date) is showing a rise http://ocean.dmi.dk/arctic/old_icecover.uk.php
WTF is happening?
NSIDC is also showing no melting http://sunshinehours.wordpress.com/
see sunshine hours a very up to date site on icy matters LOL
I Notice CT is down also I would not be surprised that they are simply making up the data as they go along Any sign of ice recovery in NH is fatal to the team


It is quite normal:
http://feeder.gina.alaska.edu/feeds/webcam-uaf-barrow-seaice-images/movies/current-10_day_animation.mp4
Steve,
i am pleased to see that you have cited PIOMAS in one of your articles as does the NSDIC, NOAA, the US Navy and others do. What changed your mind? Why do you no longer think of them as “complete crap”?
It is called parody, MR. TOOOO Stupid. Do you actually believe that the PIOMAS numbers make sense?
Steve,
PIOMAS makes clear their data and methodology and they validate their findings with satellites, moorings and the US Navy. Why would I doubt them? Because you tell me to?
However, if you can provide evidence — and independent validation — to the contrary, then I will certainly take a look at it. Until that time, I have to go with PIOMAS.
Every simplistic model that predicts the climate will behave in a more or less linear fashion has been shown to be wrong. But you believe it, so that’s all that’s important. Enjoy.
TOO hasta be Tony B. Tony! you’re back! Welcome! Say something else hysterical!
Come on now!
T.O.O posts under multiple names
Steve,
Well, I was a Lazarus but that was taken so I became “The Other One (T.O.O.), however, I have never been a Tony before. I understand that you also have a different name. Care to share?
I use a single pen name. That has nothing to do with your pretending to be multiple people.
In NZ the South Island is experiencing it’s own Arctic conditions. 🙂
Snow frustrates some, delights others
http://www.3news.co.nz/Snow-frustrates-some-delights-others/tabid/423/articleID/302176/Default.aspx
Cars trapped as heavy snow arrives
http://www.stuff.co.nz/southland-times/news/8817318/Cars-trapped-as-heavy-snow-arrives
So here we go again (happens every time ice INCREASES above AGW expectations)
CT is showing a huge fall in NH ice extent (up to date)
http://arctic.atmos.uiuc.edu/cryosphere/IMAGES/seaice.recent.arctic.png
DMI is frozen but the old graph (up to date) is showing a rise
http://ocean.dmi.dk/arctic/old_icecover.uk.php
WTF is happening?
NSIDC is also showing no melting
http://sunshinehours.wordpress.com/
see sunshine hours a very up to date site on icy matters LOL
I Notice CT is down also I would not be surprised that they are simply making up the data as they go along Any sign of ice recovery in NH is fatal to the team
Reblogged this on Gds44's Blog.
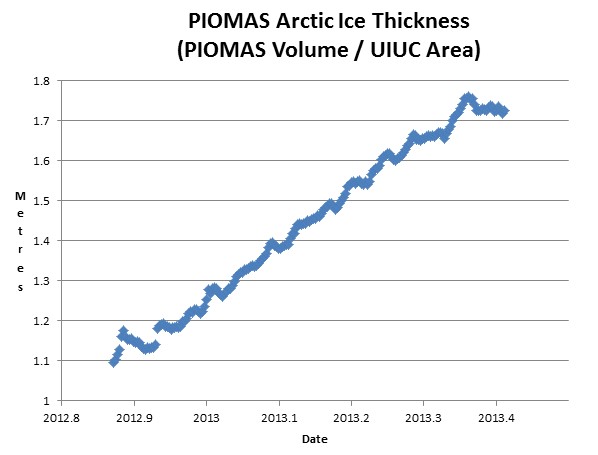
From November to April, the Arctic ice mass has increased?
Boy! That’s never happened before.