
The satellite temperature record began in January, 1979. RSS has released their May temperatures, and there has been no global warming for 17 years, which is more than half of the satellite record.
RSS_Monthly_MSU_AMSU_Channel_TLT_Anomalies_Land_and_Ocean_v03_3.txt

tphhht. That’s just noise.
The Earth has a fever, and we are all gonna die…
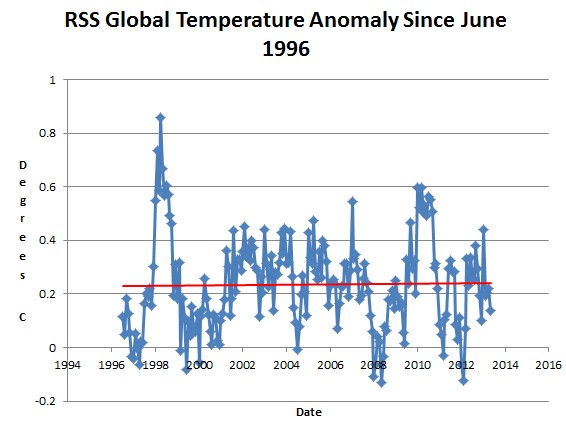
Wait a minute. I took the data and put it into excel and got this:
http://imgur.com/HLHY9gW
You can’t do a linear plot for variability like that. You should plot something like a N month moving average.
Thanks for the dishonesty once again Steve.
One can perform linear trend, polynomial trend, trigonometric trend, Taylor power series trend, hundreds more… none are dishonest. Math is math.
Each method purveys less knowledge than the original data. Each method assists us poor humans with pattern recognition. Most of all, each method standardizes ways of communicating scientific data.
Calm down. The flat red line in the graph above is harming no one.
Since Steve cherry picked his starting point, he produced the trend he wanted.
I took in 100% of the data and didn’t cherry pick anything. With data this variable, picking a linear plot is not the smart thing to do.
LOL after the coming La Nina it will be more like 19 years. Without the 1993 eruption of Mt Pinatubo it would already be 20.
“picking a linear plot is not the smart thing to do”
True, and yet, the climate nutters use it as their standard. Please see recent dialogues with the Met and re IPCC standards. So, when Steve uses linear regression to show the nutters wrong, he’s spot on. Good that you agree.
One day the climate nutters will clearly state their case, and they will be easily and clearly shown to be wrong. Until then, people like Steve continues to use their own nutter stupidity against the nutters, as I do.
He would be perfectly happy with a linear plot if it gave Nathan the answer he wanted. I think if you’re plotting 30 years of data, to scream about “natural variability” causing one to reach the wrong conclusions, is pretty far fetched.
Nope. I’d still run the data. Even more so since Steve has been cherry picking numbers for quite some time. Anything he says should be verified and not taken as the gospel.
I find it amusing how he posts all of the numbers, yet only graphs the numbers he wants to find the trend that agrees with his priori assumption.
Take all of the numbers yourself in excel like I did. You’ll find that Steve is misrepresenting the data.
We’re all gonna die, aren’t we Nathan? I knew it! Damn, I just knew it!
Nathan, the talking parrot is back. So plotting 30 years of data is ‘cherry picking’ ? How much do you want? 60 years of data? The entire AGW scare was predicated on trends over a 20 year warming period. It takes a special kind of stupid…
Nathan:
The globe is cooler that it was 6,000 years ago! Live with it! Take your pick 6, 7, 7,8 the globe has been cooling for over 5000 years with short intermission periods where the cooling slows, like now.
Looking at the RSS data since 1979 it appears that we are currently about the same as the early 1980s. Probably within the errors.
Depends on how you cherry pick the numbers, but close enough.
If you want to make the best Cherry Pie, you have to pick the BEST Cherries! 😉
Climatology is in its infancy, and it needs to learn how to act its age. Arrogant toddlers are simply not tolerable, and will eventually get spanked.
I am SO damn sick of the AGW LIARS! Al Gore being the freakin worst of the lot. Now they are trying to change colors like a chameleon by calling “AGW”, “Climate Change”. Really…., “Oh look, the climate changed.” That sneaky climate it changed again. Yeah, from summer to fall to winter then to spring. In case they missed it in first grade, that is what the climate does all on it’s own.
The idea that carbon emissions causes temperature rise in the atmosphere was in scientific literature before Al Gore’s time, so was the term “climate change”……”global warming” “climate change” has all been said before by scientists before Al Gores time, nice try though. Your partisanship is showing….
The idea that sacrifice can improve the weather has been around for tens of thousands of years.
Mother Nature NEVER does a “stable”, or unchanging climate. Look at any (untampered) long term temperature record. Vostok, EPICA, Holocene Temperature record… …take your pick. Climate is ALWAYS warming or cooling. NO HORIZONTAL LINES on the graphs, ever. Except Mann-made charts of course.
The only constant thing about climate is perfectly natural “climate change” itself.
I thank God I am living my life during the late Holocene era. My country , Canada, will be back under several kilometers of ice when the next glacial period kicks in.