
Twenty-five percent of all global warming is due to data tampering at GISS since 2004.
This is on top of all their data tampering prior to 2004.
Twenty-five percent of all global warming is due to data tampering at GISS since 2004.
This is on top of all their data tampering prior to 2004.

You are Cherry Picking on this one. If you go back further you will find that over 50% of recent warming is due to human causes! It was caused by the Al-Gore-Rhythm used to create the models they use to provide the SAT!
NASA GISS even admits that.
“Q. If SATs cannot be measured, how are SAT maps created ?
A. This can only be done with the help of computer models, the same models that are used to create the daily weather forecasts. We may start out the model with the few observed data that are available and fill in the rest with guesses (also called extrapolations) and then let the model run long enough so that the initial guesses no longer matter, but not too long in order to avoid that the inaccuracies of the model become relevant. This may be done starting from conditions from many years, so that the average (called a ‘climatology’) hopefully represents a typical map for the particular month or day of the year.”
http://data.giss.nasa.gov/gistemp/abs_temp.html
It could well be 125% of the warming was Mann Made! 😉
I found this explanation at WUWT
http://wattsupwiththat.files.wordpress.com/2013/06/gavin_models_bscapture.png
Is this a joke? The graph bears no relationship to the headline. The links provide no clue.
Sorry, I can’t cure reader stupidity
RE: Geezer – “The graph bears no relationship to the headline”
Geezer,
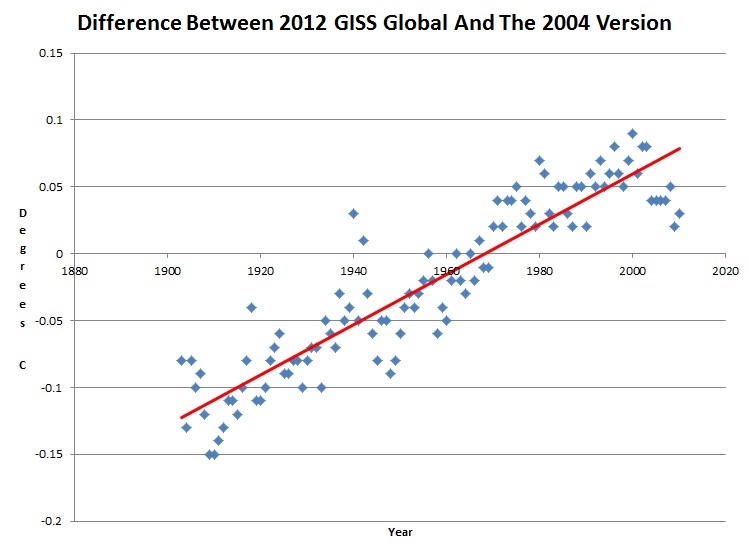
There are two files. Both files contain temperature anomalies for each year, in hundredths of degrees C, as compared to the based period 1951-1980.
One file was generated in 2004, the other in 2012.
For each year in both files, you can subtract the temperature anomalies. For example, the 1998 global temperature anomaly in the 2004 file is “56”. The 1998 global temperature anomaly in the 2012 file is “61”. 61-56 = 5. Note the values represent hundredths of degrees C, so when you look at the graph for 1998, you can see the value 0.05 plotted.
If you calculate the anomaly differences for the remaining years, and create a graph, you can see a positive trend in temperature adjustments when comparing the 2012 file to the 2004 file.
Finally, Steven asserts that the adjustment account for 25% of all global warming over the period 1901-2004.
The max value in the graph is 0.09. The minimum value is -0.15. The difference = 0.24
0.24 is 25% of 0.96
Stevens assertion is correct.