
Disrupting the Borg is expensive and time consuming!

Google Search
-
Recent Posts
- Analyzing The Western Water Crisis
- Gaslighting 1924
- “Why Do You Resist?”
- Climate Attribution Model
- Fact Checking NASA
- Fact Checking Grok
- Fact Checking The New York Times
- New Visitech Features
- Ice-Free Arctic By 2014
- Debt-Free US Treasury Forecast
- Analyzing Big City Crime (Part 2)
- Analyzing Big City Crime
- UK Migration Caused By Global Warming
- Climate Attribution In Greece
- “Brown: ’50 days to save world'”
- The Catastrophic Influence of Bovine Methane Emissions on Extraterrestrial Climate Patterns
- Posting On X
- Seventeen Years Of Fun
- The Importance Of Good Tools
- Temperature Shifts At Blue Hill, MA
- CO2²
- Time Of Observation Bias
- Climate Scamming For Profit
- Climate Scamming For Profit
- Back To The Future
Recent Comments
- Bob G on Analyzing The Western Water Crisis
- arn on Analyzing The Western Water Crisis
- Bob G on Analyzing The Western Water Crisis
- Bob G on Analyzing The Western Water Crisis
- Bob G on Analyzing The Western Water Crisis
- Hank Phillips on Analyzing The Western Water Crisis
- Hank Phillips on Analyzing The Western Water Crisis
- Hank Phillips on Analyzing The Western Water Crisis
- Hank Phillips on Analyzing The Western Water Crisis
- Bob G on Analyzing The Western Water Crisis
Here in the far north, we’ve used C02 under high pressure to pump heat from foundation supports (nearing 0 Celsius in summer) during the winter months since the inception of the technology. This works to super freeze the earth efficiently when outside temperatures are well below freezing as the C02 pulls the heat from depths through the metallic casings as a rising high pressure gas, where it hits an above ground radiator assembly turning it back into a condensed liquid allowing gravity to draw it back down the perimeter of the internal casing and super-freezing the structure. The process allows a very solid support to get through the summer months, specifically where the tundra & boreal forest have been removed above the permafrost (for construction; pipeline, buildings, antennas etc…)
We’re 1 hour from the summer solstice and mother nature will override the AGW morons in 68ish days from now and the high pressure C02 thermal siphons will go back to their designed working conditions, along with another total refreeze and long Winter.
I know of four bone heads with a rowboat in Vancouver who think this photo must be a pile of denialist shit
Only about 90% of full. Lower than usual.
http://arctic.atmos.uiuc.edu/cryosphere/IMAGES/recent365.anom.region.1.html
What exactly is “usual”, in 4.5 billion years of variability? Please expand on this.
“Usual” is a complex technical term used by climate scientists and their acolytes. They would define it for you, but then you wouldn’t be able to comprehend it anyway.
Jussi, obviously it will take a couple of years for the ice to be fully replaced. But, clearly, it’s been colder this year and, thus, the ice is returning. Don’t be thick.
But it’s thin rotten anthropogenic ice. 🙂
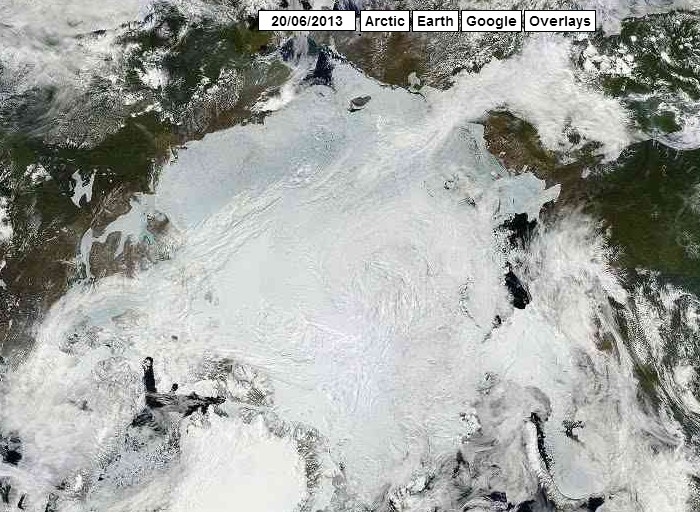
Click your link Steven, then zoom right in. To save you the trouble, here’s another link:
http://www.arctic.io/observations/8/2013-06-20/8-N89-E0
What do you see to the left of the North Pole? What do you see to the right?
The Arctic Basin isn’t actually “Full of ice” at the summer solstice, is it?
What on earth are you talking about? There are always leads and openings in the ice, even in winter.
Great link! Love that aerial photo, thanks. Bookmarked for future reference.
My pleasure TLM. Is it possible to put pictures in comments here. If so what’s the secret?
Just noticed the link under Steve’s screen cap – doh!
Pictures not usually possible. Steve will know. For pictures in blog postings I usually just post a link to Photobucket or similar.
Agreed about the leads and openings. The “leads” on the left may be vaguely typical. All the “openings” on the right, in that location at this time of year, are not.
Worth keeping an eye on?
Temperatures north of 80N have been the coldest on record this June.
Which has (counterintuitively?) resulted in far more “openings” in the sea ice near the North Pole than ever before on record in June?
June is usually a hiatus month. In most years since 2001 the sea ice extent has tracked along the line of -2 standard deviations from the 1979-2000 mean during June (the grey area in the NSIDC chart here: http://nsidc.org/arcticseaicenews/charctic-interactive-sea-ice-graph/
It is only through July that we see which way sea ice is headed. Currently the sea ice extent (as opposed to thickness or concentration) is in the same ball park as the years 2003-2006. Even during the record low in 2007 sea ice was about what it is now. 2012 was exceptional in that sea ice extent fell away rapidly from the end of May – making a record low almost inevitable. This year we have been spared that so it is very unlikely that we will see another low like 2012, although it could still easily be as bad as 2007 if the weather is unfavorable during July and August.
Where it goes from here is all down to the weather. If the winds are favorable, and not too much sea ice gets blown out of the Fram Strait, we could see a partial recovery – probably to the range 4.6m – 5.1m sq Km that we saw in the years 2008, 2009 and 2010. If there was somewhere to bet, I would put my money on 4.9m sq Km!
Last year the largest drop occurred in June.
Yes, from the end of May through June. Sorry if I was not clear. Very unusual and not seen this year (or any other year on record since ’79) so hopefully a one-off freak event.
As Steven says “There are always leads and openings in the ice”, so the Arctic Basin quite clearly isn’t “full of ice” at the moment. Unfortunately it seems as though I can’t post images to help make my point, so here’s a couple of links. Would you like to play spot the difference?
The first reveals the University of Bremen’s map of Arctic sea ice concentration at the summer solstice in 2012:
http://www.iup.uni-bremen.de:8084/ssmisdata/asi_daygrid_swath/n6250/2012/jun//asi-SSMIS-n6250-20120621-v5_nic.png
Here’s the summer solstice 2013 version:
http://www.iup.uni-bremen.de:8084/ssmisdata/asi_daygrid_swath/n6250/2013/jun//asi-SSMIS-n6250-20130621-v5_nic.png
Can you see the large areas of ice in the Arctic Basin north of 80 degrees that have a concentration of 75% or less this year, that weren’t there last year? Even if as Steven says, “temperatures north of 80N have been the coldest on record this June.”?