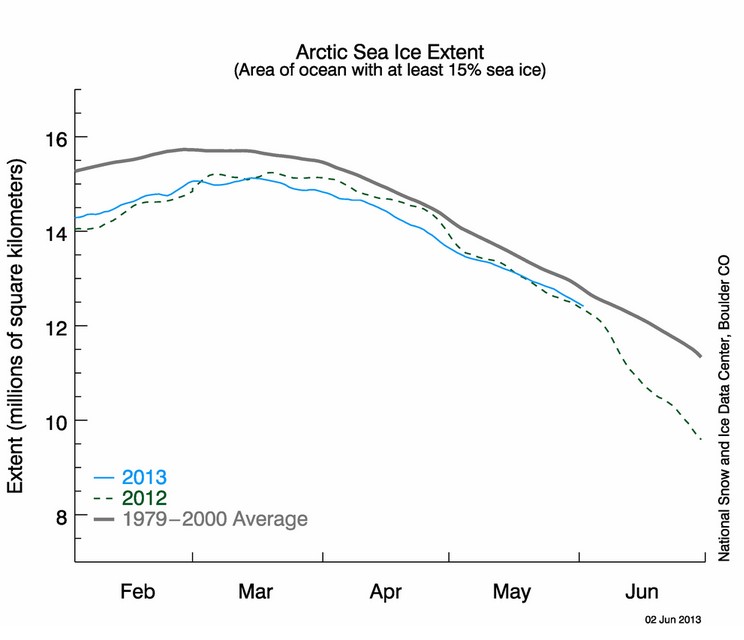
Around this time last year I caught some NSIDC monkey business, and something looks wrong again this year. They show 2013 and 2012 ice extent almost identical.
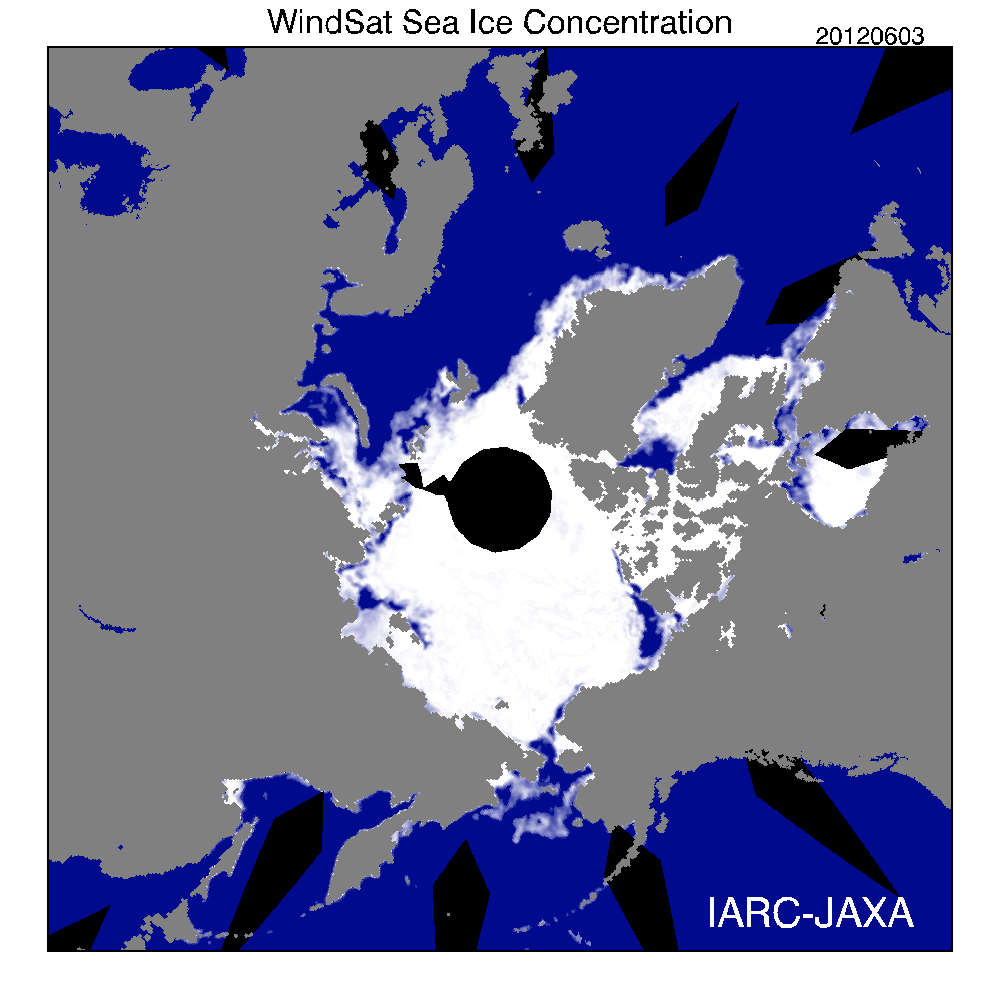
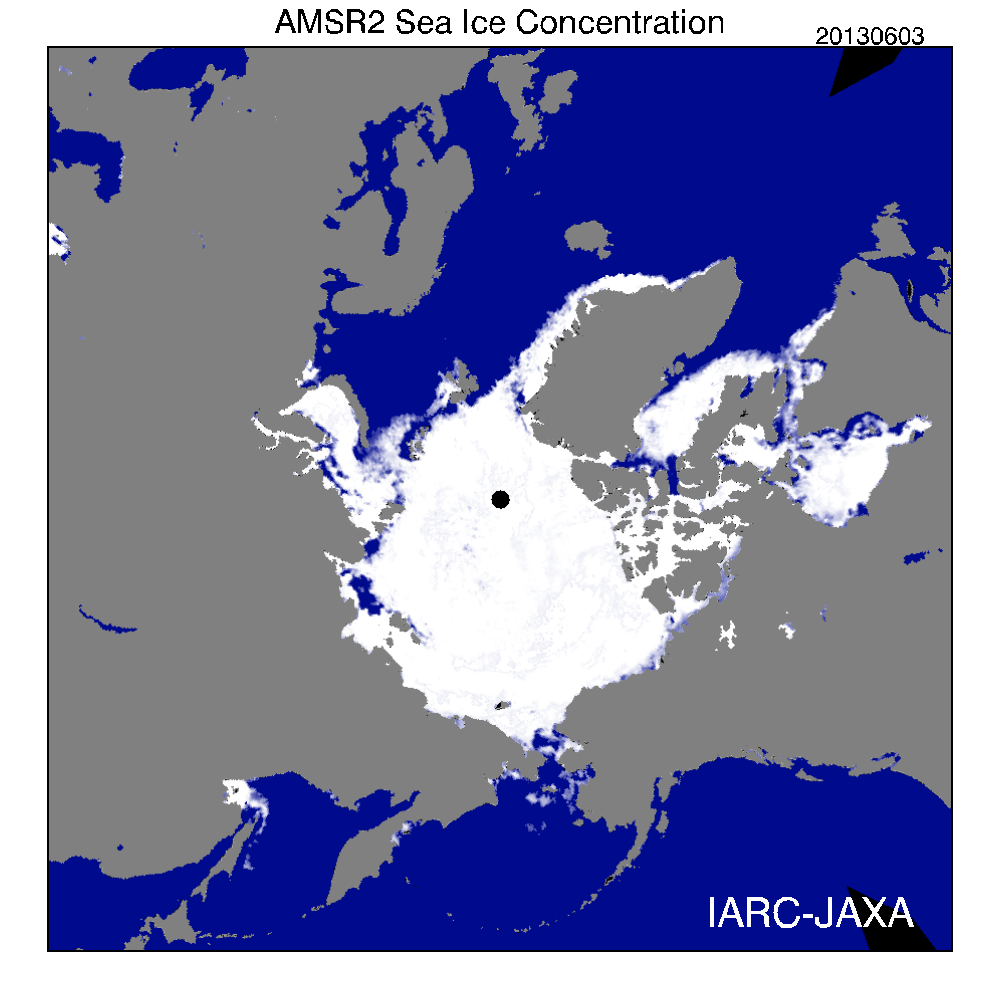
But the JAXA maps tell a very different story. There is a lot more ice this year in the Beaufort and Kara Seas than there was last year.
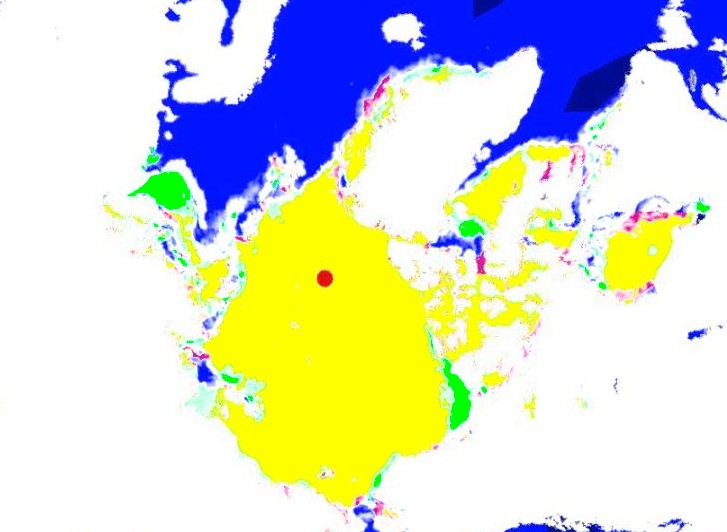
Arctic Sea-Ice Monitor The image below shows 2013 ice which was not present in 2012 in green, and red shows the opposite. The most important difference being in the Beaufort Sea, which this year is 100% concentration and last year was ice-free.
There is a lot more ice this year, and NSIDC seems to be missing it.


The liberal mind is predictable and the MSM will carry their water even if it’s in the form of ice.
What I am seeing in data from other sources is ice extent is close to 2012 but ice AREA is higher. This would mean that the ice is much more uniform. Say a storm breaks up a bunch of ice and blows it around. You might get more extent because “extent” is the region covered by 15% or more with ice but you will get less ice area. We have less extent but more area this year meaning a more consolidated ice pack that should, all things being equal, be slower to ablate. Winds and seas can change that in a hurry as we saw last year with an arctic cyclone that broke up a tremendous amount of ice and scattered it in the wind.
Interpreting area/extent ratio is hard at this time of year, because it’s affected by the onset of melt ponding. This confuses the sensor into thinking there’s more open water than there actually is. It affects the area measurement much more than the extent measurement, because melt ponding alone will reduce the (apparent) area, but isn’t sufficient to push the ice below the 15% threshold used to define extent.
Last year there was very substantial melt ponding in Laptev and East Siberian seas by the start of June (there were showing up bright blue on the MODIS satellite at visual wavelengths). This year the melt onset is later and the ice is still snow-covered.This is almost certainly the main reason why the area is proportionately higher this year (extent this year is ~1.2% above last year, area is 6% above last year). I don’t think we can tell much about the fragmentation state / concentration of the ice from microwave data alone.
But Maslowski said that the Arctic will be ice free this year. LOL
The fear mongers are going to do whatever they can to present a bullshit picture of doom. The Arctic is fine. Temperatures are fine. But now in the UK, after just suffering the coldest spring in a century and nearly running out of gas, like the Energizer Bunny the Chicken Littles are still at it, trying to hobble their own country with yet another climate change bill that has been called “an economic suicide pact:” http://www.telegraph.co.uk/comment/telegraph-view/10096133/Remove-the-blinkers.html
A good comment at the Telegraph article by scott_east_anglia:
It looks as though the 400ppm CO2 concentration is being used as a trigger for a pre-prepared desperate alarmist campaign.
How can the alarmists continue their propaganda campaign without feeling mortifyingly embarrassed?
There was no empirical evidence of the effect of changes to the concentration of atmospheric CO2 on the climate when the campaign started, and there is still none today.
When will they ever give up?
Not until the IPCC is disbanded, and the public funding of the anti-west green pressure groups is stopped, I suppose.
Their conjecture has not only failed, but failed miserably, and it has been seen to have failed. Enough time has passed to make their predictions look silly. Nothing they forecast over the last 30 – 40 years came to pass.
The cod-science they conjured up to justify a headline-grabbing warming figure dreamed up decades ago has come apart at the seams.
Their hypothesis was blown years ago.
How can they continue with their lies without even blushing?
Plus, this headline: Snow in June: Russia’s Siberian town in absolute anomaly (PHOTOS, VIDEO) http://rt.com/news/siberia-june-snow-kemerovo-130/
See the comments – even Russians joke about Al Gore!
There’s one other main difference which you cut off in your bottom panel: 2012 had quite a bit more ice still hanging around in the Bering Sea at this point.
In regard to the reason for the discrepancy between sources when comparing 2012/2013, I think you have it backwards. It’s not that NSIDC is missing this year’s ice, but that they showed more ice at this date in 2012. I can’t check for sure because NSIDC don’t archive the daily files, but if I recall correctly, last year they had ice hanging around in the Kara for longer than the other sensors did. If you compare the NSIDC and IJIS charts, the rapid drop in extent at the start of last year’s central basin melting season (early June) shows up a little earlier in IJIS than NSIDC.
Assuming that the ice hangs around in the Kara this year, then NSIDC’s 2013 line will begin to diverge (upward) from the 2012 line in a couple of days’ time, when the 2012 line takes a nose-dive.
It’s the 5 day smoothing delay they inserted last year in order to prevent the line going over the 1979-2000 average line.
Arctic Ice extent measurement is as corrupt as any tender bidding process in China and as “fixed” as all the slot machines in Vegas are. A glacier will have to arrive at the NSIDC head office before they say there is more Arctic ice than 2007!!
Andy:
I can vouch for the Slot Machines in Vegas not being “Fixed”. They were designed to be random and they are randomly tested to insure they are random in their payouts. If they say they have a 95% payout, they are tested 1000 times to determine the actual payout. The software is tested and machines are pulled from the floor to be tested at any time.
The Global Ice Extent so called measurements are based on a variety of Al-Gore-Rhythms used over the years. Along with “improvements” in the resolution of the imaging and masking of the land. Maybe in a few hundred years we might know what to expect from the ice. But currently the Science of Ice research is just taking “Baby Steps” and like any child thinks it can do what the big boys do. There is not enough real data to determine what is Normal. Personally I say “Normal” is constant change in amount of ice due to a variety of factors, temperature playing a small part as wind speed and direction are the major contributors at both poles.
True that.
And it helps illustrate the irony that Las Vegas casinos are thoroughly more honest than the AGW cult of fraudsters and madmen who lie every time their lips are moving.