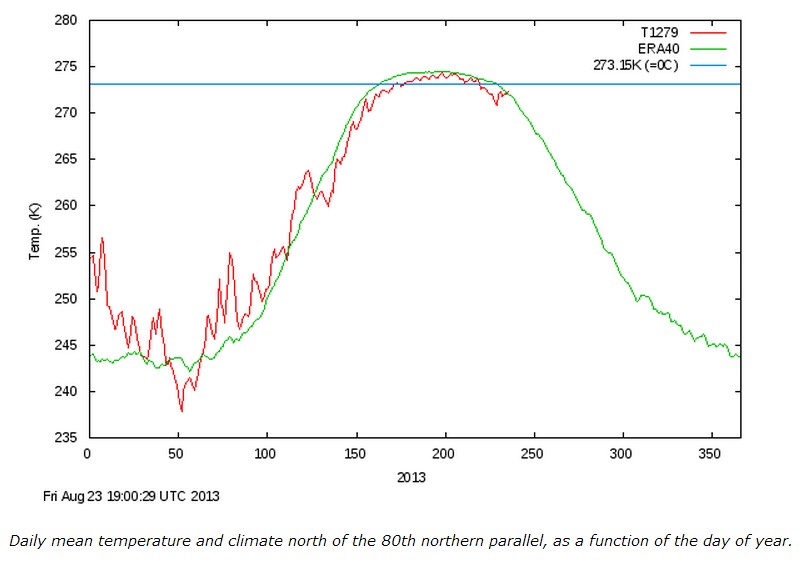
Thanks to latent heat released by new ice formation, the Arctic has ended a 110 day long streak of below normal temperatures.
COI | Centre for Ocean and Ice | Danmarks Meteorologiske Institut
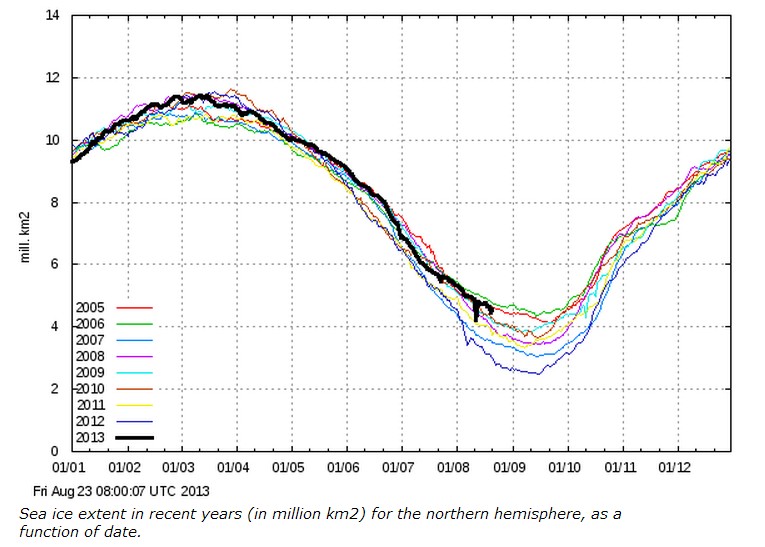
This cold has contributed to a record increase in sea ice over last year.
COI | Centre for Ocean and Ice | Danmarks Meteorologiske Institut


So it’s getting colder.
How do you like your warmists. Fried or boiled?
Anyone out there explaining why the temperature jogged back up slightly? Or has that been seen before?
The liquid to solid phase change is exothermal.
Here is a good visual demonstration:
http://www.youtube.com/watch?v=6o91iS4PRIQ
This is why it takes ice so long to melt as it has to absorb the same amount of heat to return back into liquid state.
Also, changing from gas to liquid state, (water vapor to rain) is also exothermic.
Depending on the direction, heat is either absorbed or released.
It’s a great temperature regulator.
Gee weird, just after Al Gore sells to them, what a coincidence, must be true then? http://www.treehugger.com/climate-change/al-jazeera-america-airs-more-climate-coverage-one-day-other-networks-have-four-months.html
I’m looking forward to the freeze season. Will it be as fast as last year. If yes, then it could be a lot more ice in the winter and next year the ice will take longer to melt.
Maybe the Canadian coast guard needs a few more ice breakers for the Arctic cruise ships or cruise companies will get out of business.
https://www.facebook.com/photo.php?fbid=578385958892174&set=a.570834922980611.1073741828.570831122980991&type=1&theater
The only reason the DMI graph went above normal is because cross-polar-flow punched warm air into the heart of the arctic. First it was warm air from continental Europe and then not-so-warm air from the North Atlantic. What this did was to displace the really cold air out to the edges, until the DMI temperature map showed a sort of horseshoe-shape of sub-freezing air around the invasion of above-freezing air. Towards Alaska some of that air was down to minus eight Celsius, (17.6 Fahrenheit,) however, because it lay south of 80 degrees, it is not included in the data that makes up the DMI graph.
When the cold air is displaced to the edges of the ice, perhaps it increases the freezing at the edges. In any case, the cross-polar-flow is breaking down, and I don’t expect the area north of 80 degrees to remain above normal.
See update at bottom of: http://sunriseswansong.wordpress.com/2013/08/16/the-big-chill-sea-ice-version/
“the Arctic has ended a 110 day long streak of below normal temperatures.”
Steve this statement is easily the single most powerful statement to use against warmistas.
It’s simple to understand and impossible to argue against such a clear statement.
Is there anyway you could give us a running tally of days below normal for the year?
Or, is there somewhere I could download the data that is used to make this chart?
Thanks,
Al
I don’t know where they keep the digital data for that graph. It would be nice if they linked the source.