
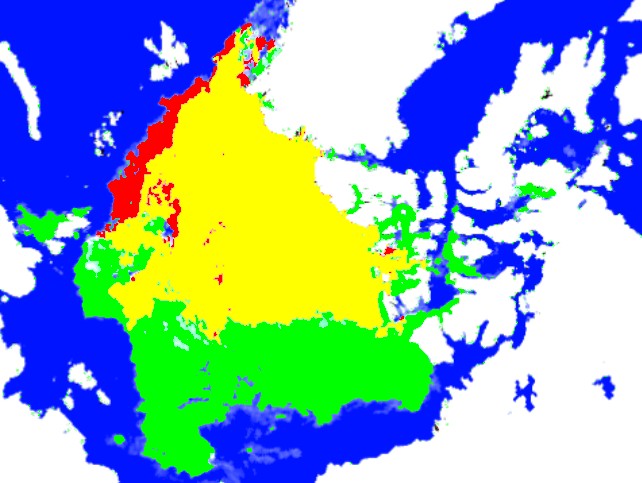
Green represents ice present in 2013 which was not present in 2012. Red shows the opposite.
Disrupting the Borg is expensive and time consuming!

Google Search
-
Recent Posts
- Analyzing The Western Water Crisis
- Gaslighting 1924
- “Why Do You Resist?”
- Climate Attribution Model
- Fact Checking NASA
- Fact Checking Grok
- Fact Checking The New York Times
- New Visitech Features
- Ice-Free Arctic By 2014
- Debt-Free US Treasury Forecast
- Analyzing Big City Crime (Part 2)
- Analyzing Big City Crime
- UK Migration Caused By Global Warming
- Climate Attribution In Greece
- “Brown: ’50 days to save world'”
- The Catastrophic Influence of Bovine Methane Emissions on Extraterrestrial Climate Patterns
- Posting On X
- Seventeen Years Of Fun
- The Importance Of Good Tools
- Temperature Shifts At Blue Hill, MA
- CO2²
- Time Of Observation Bias
- Climate Scamming For Profit
- Climate Scamming For Profit
- Back To The Future
Recent Comments
- Bob G on Analyzing The Western Water Crisis
- arn on Analyzing The Western Water Crisis
- Bob G on Analyzing The Western Water Crisis
- Bob G on Analyzing The Western Water Crisis
- Bob G on Analyzing The Western Water Crisis
- Hank Phillips on Analyzing The Western Water Crisis
- Hank Phillips on Analyzing The Western Water Crisis
- Hank Phillips on Analyzing The Western Water Crisis
- Hank Phillips on Analyzing The Western Water Crisis
- Bob G on Analyzing The Western Water Crisis
The Arctic is quite surprising this year. There is a major difference when comparing this year and last.
As I have explained before, IMO the NIC records are more reliable during the melt season, due to passive microwave reading missing ice underneath surface meltwater.
In 2012, NIC reported the ice extent on Aug. 26, 2012:
8/10ths 3,557,972 sq. Km.
Marginal zone 2,591,333 sq. Km.
Ice Extent 6,149,305 sq. Km.
NIC reported the 2012 minimum ice extent on Sept. 21, 2012:
8/10ths 3,275,795 sq. Km.
Marginal zone ,923,871 sq. Km
Ice Extent 4,199,666 sq. Km.
Notice that most of the ice loss from now to the minimum is the reduction of the Marginal Zone.
Now look at this year.
For comparison NIC reported the ice extent on Aug. 26, 2013:
8/10ths 4,895,884 sq. Km.
Marginal zone 1,673,110 sq. Km.
Ice Extent 6,568,994 sq. Km.
Not a great difference in the total, but a much larger amount of the thicker ice (8/10ths).
And the Marginal Zone is much closer to the minimum reached last year.
Interesting month to come. Barring another unusual storm event, the recovery this year will be amazing.
One wonders why the crew of the Arctic Joule gave up so early. They could have rowed for at least another week before they had to turn around because of ice. I guess that’s the benefit of getting immediate data from satellites. Shame Franklin didn’t have satellites in the 1850’s. He would have made it through the NW passage over 150 years ago.
The Joule crew was never in any danger from the ice or the cold. They had a fabulous blowtorch with unlimited fuel to warm themselves with.
Should we also wonder if these other guys will make it through the ice? Via an 8/20 NewsHour blog piece http://www.pbs.org/newshour/rundown/2013/08/china-has-a-new-short-cut-thanks-to-melting-arctic-ice.html
” … last Monday, a Chinese ship set sail for western Europe using a previously-unavailable shortcut. The commercial cargo is heading north from Dalian along Japan and past Alaska through the Bering Straight, following the Northeast Passage as it chugs towards Europe through the melting Arctic sea ice above Russia. ….”
It was only unavailable because they did not ask permission to use the route. That route has been used by Russia for many years.
Meanwhile, my ignorance of current ship locations does no better than this page http://www.marinetraffic.com/ais/shipdetails.aspx?mmsi=477265600 with a location only as current as 8/17, but the ship is at least pointing northeast, having a destination of Rotterdam on 9/9.