
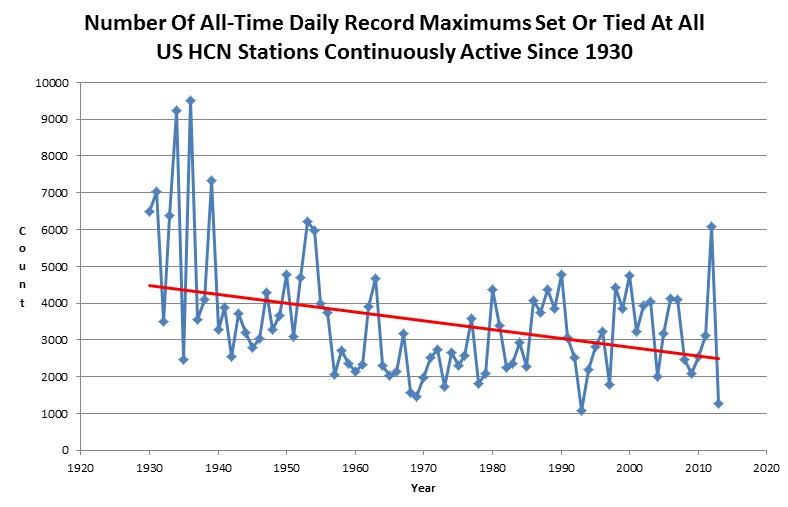
The number of all-time record daily maximum temperatures set or tied* per year has dropped almost in half since the 1930s, for all stations which have been continuously active during the period.
* Disclaimer for alarmists : read the bold text above before you make a fool out of yourself posting a stupid comment.
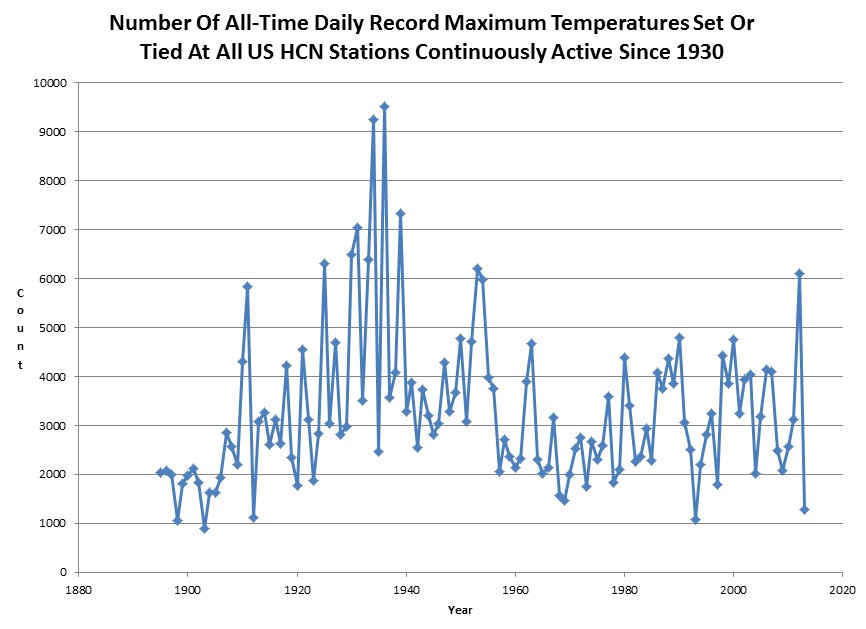
Below is the complete time series from 1895-2013

That is obviously “Cherry Picking”! You want to only use stations that have been in continuous use since the 30s! That is not how the BEST “Experts” do things! 😉
Really, so you think those with the least data sets are more accurate than those with the most data sets? Where did you learn statistics? The more accurate data sets the more accurate the picture. Any one can take an anomaly and throw it in somewhere and skew the information….Oh wait that’s what Al Gore did for his new religion.
Denier!!!!!!!!!!!!!!!!!!!!!!!!!!!!!!!!!!!
LOL
clapping seals (AR, AR, AR)
it’s a hoax
I wonder how long it will take before some alarmist (even with the explicit warning issued) explains to you your “obvious mistake!” Five, four, three, two…
Well… here’s the obvious mistake. The author tracks new all-time record highs. If we had a completely (non-warming) climate, over time there should be exponentially fewer and fewer all-time records set until there are 0 in an average year. The fact that we still have a significant number of all-time records being set means that our climate is warmer than it has been historically.
Another mistake, or at least an assumption that should be clearly stated, is that the author chose to use only US weather stations. Climate models show that even with significant warming, there are areas of the globe that will not experience local warming and may even cool.
Note, the other “obvious mistake” of picking only stations that have been around since 1930 is not actually a mistake. By adding new stations to the data mid-way through, it would make the data appear to show more warming than there is. But as it is, the data still shows warming.
Also, choosing a random statistic like new all-time record highs can be easily misleading. Just look at the average temperature recorded across the globe to see if there’s warming. Pretty simple. http://en.wikipedia.org/wiki/Temperature_record
Another moron shows up. These are all time record highs set or tied. There is no time bias. Where do they crank you people out at?
Quickski might be on the Russian boatski with nothing to do-ski except write crapski. It’s called doing science-ski.
Hmmm… if there’s actually no time bias, this might be interesting. But if there’s no time bias, the years 1930-2012 shouldn’t look exactly the same when you add in 1885-1930(and they do). The records set earlier should displace records set in the years 1930-2012… unless EVERY SINGLE record was tied (not broken) at every single station from 1930 on. My guess is that you’re reading the data incorrectly and these are only NEW records or ties – which would mean that your claim that the data set can be run forwards or backwards in time is incorrect.
Can you provide a link to the raw data you used?
There is no time bias. Period, The 1930’s were hot.
ftp://ftp.ncdc.noaa.gov/pub/data/ghcn/daily/hcn/
Do the record lows decline in a similar fasion?
Which heatwave looks more “unusual”
“Unusual Heatwave”
Iowa, 1927.
Waukee, Iowa
9/8 – 99
9/9 – 98
9/10 – 100
9/11 – 98
9/12 – 98
9/13 – 95
9/14 – 97
9/15 – 98
Avg high – 97.6
“Unusual Heatwave”
Iowa, 2013
Des Moines
8/24 – 95
8/25 – 96
8/26 – 99
8/27 – 99
Avg high – 97.3
In Washington, DC it was 108 at the Naval Observatory on September 7, 1881, the highest temperature ever recorded at any major weather station in the DC area. Unbelievable for September!
All record setting counts decline over time. It’s normal for any function. Here’s an example that’s easy for you to understand: How many records were set the first year? Answer: all of them. How many were set the next year? Less than all of them.
And we have a world class moron stepping up to plate. Did you not read the warning I gave you about stupid comments?
You must know by now Steven that the ‘believers’ can’t help themselves, once a world class moron always a world class moron. I always tell the WCM’s follow the money.
cruzzin77,
I have been preaching that for 20 years. Follow the money. Al Gore was worth less than $2Mil as Veep, no his net worth 20 years later is over $100Mil. DOH!!! WCM’s do you get the picture? Your High Priest of Climate Change has been fleecing you and everyone else he could dupe.
Well he is right if there is no warming trend in the data set. I think he just refuted his own argument but probably isn’t bright enough to realise it. 😉
“The number of all-time record daily maximum temperatures set or tied* per year”
Think about that.
Ha! We have a winner! 🙂
Ray’s isn’t a stupid comment. Just saying “set or tied” doesn’t change the fact that the interpretation of the graph is misleading. Even with a warming climate, the number of records set OR TIED every year will decline.Your data are not linked to your conclusions.
You’ve shown that the maximum temperature doesn’t increase every year in every location, but nobody is claiming that it is. You’re arguing with (stupid, alarmist) straw men. Again, the simple way of determining if there’s warming is to look at the average temperature of the planet over time and see if it goes up. http://en.wikipedia.org/wiki/Temperature_record
Alternately, the simple way of hiding your scientific illiteracy is to call everybody else stupid.
And you are showing your math illiteracy, Quickski.
Nitwitski – the number of records set or tied will decrease for all years in the series with a longer time series. There is no time bias.
Ray — Let’s walk you through it in baby steps. To keep the math simple, let’s take the example of a 100-year log of temperatures in an unchanging climate (constant mean and variance). Further, let’s say that our measurement resolution is so fine that we don’t get any ties. (I don’t think our host made the major point here.)
In the 10th year of the period, there is a 10% chance of setting a record. In the 100th year, there is a 1% chance of setting a record. That is the point you are trying to make. But wait! In the 90 years since the 10th year record, there is a 90% chance that that record will be broken. So at the end of the whole period, there is a 10% x 10% = 1% chance that the 10th year will still hold the record. It is trivial extension to show that this is true for every year in the period. If the climate is unchanging, at the end of a period, each year has an equal chance of holding the record.
This should be an easy point to catch – how so many people miss it is beyond me.
It is simpler than that.
No record is assigned until all of the years have been considered (i.e. “all-time records”). It makes no difference if the algorithm is run forwards in time, backwards in time, or randomly. The results are exactly the same.
Actually, that’s not the way “all-time records” are reported. For example, here’s the NCDC data I pulled for Washington DC:
Date / Variable / Type / Record / Prev Record
07-08-2012 High Minimum Temp All-Time Record 83 °F 82 °F (07-24-2011)
07-30-2011 High Maximum Temp All-Time Record 106 °F 105 °F (07-23-2011)
07-24-2011 High Minimum Temp All-Time Record 82 °F 82 °F (07-22-2011)
07-23-2011 High Maximum Temp All-Time Record 105 °F 104 °F (08-01-1999)
07-22-2011 High Minimum Temp All-Time Record 82 °F 82 °F (06-27-1998)
06-26-2006 Maximum Rainfall All-Time Record 7.37 in 6.28 in (06-22-1972)
08-01-1999 High Maximum Temp All-Time Record 104 °F 104 °F (07-07-1999)
07-07-1999 High Maximum Temp All-Time Record 104 °F 104 °F (07-06-1999)
07-06-1999 High Maximum Temp All-Time Record 104 °F 104 °F (08-18-1997)
06-27-1998 High Minimum Temp All-Time Record 82 °F 82 °F (07-16-1955)
08-18-1997 High Maximum Temp All-Time Record 104 °F 104 °F (07-31-1954)
01-17-1982 Low Minimum Temp All-Time Record -10 °F -5 °F (01-11-1982)
01-11-1982 Low Minimum Temp All-Time Record -5 °F -1 °F (01-17-1977)
“All-Time Records” for High Maximum Temp occurred once in 1997, three times in 1999 and twice in 2011. All are considered “All-Time Records” in the National Climate Data Center database. So, if the NCDC data was used to generate the chart above, Washington DC is counted six times.
they have been drinking too much fluoride. …its just simple common sense…the longer a record has stood the more statistically vulnerable it is…believe in global warming then please explain to me death valley’s 134 degree record being made in 1913!! it hasnt been broken worldwide since…. (Libya record of 136 was declared unreliable due to improper placement of thermostat)
Kingbum,
You can lead a horse to water but you can’t make him drink. In this case you can lead a moron to truth but you can’t make him think. Lets use something they can’t bastardize Who had the MOST home Runs in a Single Season? Barry Bonds at 36 HR, he also holds the all time career high of 73 HR. It does not matter if any other player comes along and hits 35 HR in 110 games and gets injured, He DID NOT break the single season record. IF a player plays only 4 years and scores 72 total home runs, he still did not beat Barry Bonds ALL TIME Record. All kinds of other statistical data YES, but the Record NO!! A Record is a Record is a Record!! By any other name….It’s still a Record!
Face it…the alarmists *just can’t deal* with anything that doesn’t fit their preordained dogmatic
TEMPLATE…..they start screaming for their ‘science’ mommies like Lou Costello used to scream
for Bud Abbott in their films whenever he got himself in some sort of stupid jam (“bb-Abb-ott, hey
Abbbb-ottttttt!!!!!)
Ray is correct.
1st year record.
2nd year 1/2 chance of setting a new record.
3rd year 1/3 chance of setting a new record.
4th year 1/4 chance of setting a new record.
and so on…
Actually, what is amazing is the incredible spike we had in 2012.
So, how exactly does this graph disprove global warming?
Is it actually possible for humans to be as stupid as you pretend to be?
Statistically speaking the title mentions “All Time Daily Maximum Temperatures” since 1930 are in a decline. They are indeed in a decline and within the next 20 months, that decline will become more pronounced!
Do you get that Jeffrey?
How exactly did the information in this chart get generated? Did they take the number of “All time Daily Maximum Temperatures” no matter what the year and divide by the number of years? Because the way it’s worded it sounds like with each passing year, we are getting fewer temperature records which is what one would expect.
Because of the big spike in 2012, it appears my original post was correct. The graph is the number of records for that year, for each year that appears on the bottom.
What does “all-time records” mean genius?” Why don’t you try reading the text before making a fool out of yourself? I specifically warned people like you to use your brain.
http://stevengoddard.wordpress.com/2013/08/30/algorithms-for-morons/
So, my orginal post was correct. Thanks for clarifying.
1st year record.
2nd year 1/2 chance of setting a new record.
3rd year 1/3 chance of setting a new record.
4th year 1/4 chance of setting a new record.
and so on…
So, as time passes we would expect the number of new records to decline.
Exactly so. Assuming a stable climate. And neglecting any record temp ties.
So have you considered what a decline in both the number of new record highs and tied-record-high temps means??
Take your time to think it over…….
Jeff,
Stop being a moron. No record is counted until all years have been scanned. If 1947 is higher than 1936, then 1936 can not get a record recorded for that date.
You really can’t possibly be as stupid as you pretend to be.
The algorithm has no time bias. It can be run forwards, backwards or randomly in time, and comes up with exactly the same results.
Now shut up and use your brain.
Please Jeff, it is only a record for that year in the first year. 100 years later if that is still the record, what does that mean?
We have about 6,000 record highs for 2012. For simplicity, let’s say we have about 10,000 record highs for 1930. The expected number of record highs for 2012 should be about 10000/82 = 122. So we should have had about 122 record highs for 2012, instead we received 6,000!
Jeff, you are an idiot. Each year has exactly the same odds of setting or tying the “all-time” record. If there were 100 years of data, then the odds of being the highest during that 100 years are 100:1 for each year.
How many actual, new records for 2012. i.e. not a tie of a previous record??
That isn’t the point.
And even given your number with ties included…..
What does that say about the trend?
Sorry Steve.
Didn’t mean to step on your point. (send me your email addy please)
shazzam, you are completely missing the point.
Steve,
Sorry for the confusion. We use slightly different styles in making points, and I should have indicated that I was addressing Jeff. My bad.
Your posts showed-up in between the ones I responded to Jeff and made it look like I was addressing you. WordPress can be so literal about timestamps……
I understood who you were addressing. Jeff’s confusion is that he doesn’t understand the algorithm. He thinks that the records are being accumulated sequentially through time. They aren’t. No one gets assigned a record until all years are compared.
It has nothing to do with ties
Jeff, tis simple in the statement ALL TIME RECORD continuesly active. So the hottest days at those stations will hojd the record. So the chances are, if we are having unprecedented global warming, that the highest reading at those continues stations would be recent. But in fact most of the CURRENT highest readings occured in the 30s and early 40s. Those recorde, despite 75 years of unprecented warming, have yet to be broken. An all time reading has an exactly equall chance of occuring anywhere in the period specified. The US was warmer back then, and the charts used to show this, before Hansen.
I have question…If there are records broken in 2013, then would that cause the records in the previous years to go down? If that is so, why not use a pie-chart graph?
If September 7 breaks the 1936 Sept 7 record in Aurora, Illinois, Then 2013 increments one, and 1936 decrements one.
If September 7 ties the 1936 Sept 7 record in Aurora, Illinois, Then 2013 increments one, and 1936 stays the same.
The algorithm is completely fair. No year has any advantage over any other year (other than UHI.)
I’m trying to understand this. Let’s say it is 1930 and there are 1,000 new temperature records because it is the first year. It is then 1931 and 500 of those temperature records are broken.
Would the chart show 1,000 for 1930 and 500 for 1931? Or would it show 500 for 1930 (because those haven’t been broken) and 500 for 1931?
Look at the graph, and answer the question yourself. Does it look like there were a huge number of records in the first year?
LOL, Steve. You need to make an explanation for this under Dorothy. It comes up every year, multiple times per year. I can see why people might think it on first pass, but their reluctance to give up on it after even the simplest of questions is impossible to comprehend.
-Scot
O.K. got it. Then my previous posts were incorrect based on a misunderstanding. I stand corrected.
..you made me take two aspirin
So it should clear now that the 1930s were much hotter.
The EPA confirms this
“Heat waves occurred with high frequency in the 1930s, and these
remain the most severe heat waves in the U.S. historical record”
http://www.epa.gov/climate/climatechange/pdfs/print_heat-waves.pdf
Scientific theory does not concern itself with a singular occurrence or a singular study. In fact, it takes many studies before a trend is recognized. Now we know that looking at the long range climate, that the world was in a cooling trend & that appears to have been interrupted. Then followed by steady or increasing temps. As for why certain climatic events may occur, those can be a challenge to explain. The world’s climate is hard for even today’s best supercomputer to model. But there are some astonishing events occurring, like the loss of glaciers around the world, virtually all are in retreat now. Both the Artic & Antartic are losing ice at rates that have never been documented. Which is now affecting some species of polar bears as they find it harder to find their usual food. So while we may not be experiencing the hottest summer ever, there are many other trends that are reason to suspect that there is a man-made cause to what we are experiencing
Cheers !
Computers don’t model climate, programmers do.
Glaciers have been in retreat for 250 years.
http://trove.nla.gov.au/ndp/del/article/17557868
Sandman. The Antarctic is not losing ice. The Peninsula is, but the rest of antarctica is gaining ice. No fibbing please.
The title should read differently…
Number of all-time daily record maximum temperatures set or tied per year.
Should be something like…
Number of all-time daily record maximum temperatures still standing by year.
No
Why?
If CO2 is 400 ppm and water vapor in the tropics can be up to 4% of the atmosphere, it means water vapor is 40,000 ppm in the tropics which is 100 times more than CO2. But it’s 100 times more by weight, and weight is not what matters, but the number of molecules that matters. And since a CO2 molecule is 2.5 times heavier than a H2O molecule, it means there are 250 times more water vapor molecules in tropical air than CO2 molecules. And since each water molecule is a BETTER absorber of infrared than a CO2 molecule, I’m figuring that water vapor is 300 times more important as a greenhouse gas than CO2 in the tropics. And since the tropics is where earth gets all its sunlight, I am here to say that CO2 is a negligible greenhouse gas. The greenhouse effect on earth is caused by water vapor, period. All the other gases don’t mean a hill of shizzle.
I’m waiting for a libtard to answer to my “hill of shizzle” argument. And when you do, try not to accuse me of working for exxon mobile, or talk about how 97% of the “scientists” are in consensus, and try not to snow me with a bunch of jargon. I would love to hear your answer.
Add more to my argument……the figure of 250 times more water vapor does NOT include clouds, which are liquid water droplets, and can change to vapor at any time if the air gets warmer. So the figure of 300 jumps up to at least 400 if you include clouds as potential water vapor.
And if you include the latent heat of water vapor condensing into rain, the number goes over 1000. So you can forget about CO2, it’s not worth a giant mountain of shizzle.
I guess that I’m more confused about why people think this is some great triumph… Yes, science may have made a mistake. Yes, science will continue to make mistakes… But science doesn’t really care whether it’s right or not. You can’t ‘win’ against science by saying, “Haha! Global warming isn’t real!” (Which it might still be, saying otherwise using these models is dubious at best.) Certainly, there have been some people who have overreacted to global warming, but I’d say that there is the same proportion of fervent “climate-changers” as there is radical christians who commit crimes based on their religion. In conclusion, I guess, science always triumphs, eventually, over ignorance (and… graphs posted on blogs) because it is based on the assumption that its conclusions are wrong.
Sounds like your belief is a religion
Your stats make sense. Most of the early ‘warming’ data resulted from the lack of input from the USSR weather stations in Siberia which went off line after the USSR went off line. By removing the low temperatures the average temperature worldwide appeared to rise; ergo, AlGore and his hysterical bleating, green power, EPA atrocities, economy-killing regulations etc.
And does that mean the non-record breaking days’ temperatures can be ignored?
Records aren’t isolated. They almost always occur during extended periods of hot weather.
Why would you be looking at ONLY the record setting temperatures, it is an average of ALL temperatures; an average that has increased in the past century by the way. You are simply cherry picking information.
This is only one post in many.
Look at all the posts before you start yelling cherry picking.
Steve gives out data one bite at the time. (I generally will drown you in data.)
… this is the “US”, right? Unfortunately, these affects take affect globally and the numbers (or graphs) paint a much different picture. And to Gail, I didn’t click this link to read the authors whole life story. The author assigned his own keywords and they include “global warming”. This page exists individually – perhaps the author should link to related posts that would help this example?
P.S. I’m not “alarming”, I’m simply making a point. I have yet to announce my stance on the subject.