
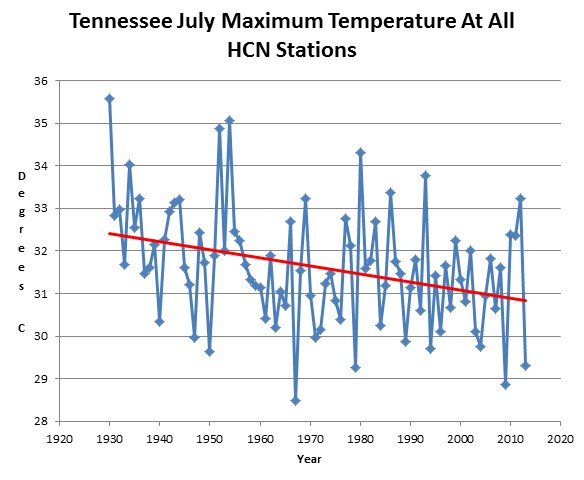
July afternoon temperatures in Tennessee have been plummeting over the last 80 years, and were the fourth coolest on record this month.
July afternoon temperatures in Tennessee have been plummeting over the last 80 years, and were the fourth coolest on record this month.

Because he’s too busy blowing hot air everywhere else.
Weekend temperatures in Pipestone plummeted to lows not seen for 102 years as a cold air mass from northern Canada slipped down into the region.
http://www.pipestonestar.com/Stories/Story.cfm?SID=43732
This tweet from Joe Bastardi
https://twitter.com/BigJoeBastardi/status/359633105469968385/photo/1
shows Canada pretty cold, with negative world anomalies for July at -0.136 C, but this is the first report I’ve read about actual low temps in Canada.
Thanks Argiris.
I found a way to show a lack of warming of the daily min. The urban heat island affects the variability in minimum temperatures by preventing the coldest nights to be as cold as before. So for every July, you measure the variability in min temps. I take the distance between the 3rd warmest and the 3rd coolest night and I call it the min-range. If you want to compare 1920-1939 vs 1990-2009, you take all the stations within a radius of around 50km. For each station of 1920-1939 and each station of 1990-2009, you calculate the average temperature and the average min-range. And you plot the variation of temperature as a function of the variation in min-range. What you find is a warming when the min-range goes down and a cooling when it goes up, and little change in the middle. The max-range does not change much except in very large cities where the coldest nights of the month might be warmer than the rural stations. When there is snow melting, the daily max is also affected by the UHI. So you also have to graph the variation of average daily max as a function of the variation in min-range. It is also possible to look at the variation in diurnal temperature range as a function of min-range: very little change from what I have seen.
A generalization of the concept is to have a stat that is correlated to UHI, or correlated to the fact that a station has much warmer nights than its neighbors. And show that the warming of the last 60 years is also mostly a function of the same stat.
One stat is to take the ratio of the variance in daily max with the variance in daily min. I can’t see how this stat could change due to CO2.
One advantage of taking the 3rd warmest/coldest daily-max/daily-min, it shows that the 3rd coldest night is the first to be affected by UHI. Sometimes the 3rd warmest night and 3rd coldest day are affected. I have never seen a 3rd warmest day be affected in July. In a month with a lot of snow melting, the 4 stats are affected. An alternative to those 4 stats would be to take the 4th power of the distance to median for all values over/under the median. The 4th power makes it more sensible to the extremes, it might be better than the simple variance. It is probably less noisy than the 3rd warmest/coldest.
We have had an AWESOME summer here in Nashville this year! We have yet to hit a 100F, which is very unusual by this time of year. Our temperatures have been mostly in the mid to upper 80’s with an occasional spike into the 90’s, but not real often. I have gotten to play more golf this year than I have in many years, partly because the temperatures have been so mild. However, we have gotten a whole lot of rain this year as well, which has, on occasion, has canceled a couple of golf outings. But hey, our grass has never been greener! And the golf courses are all in fabulous shape! If this is what “climate change” is all about, I WANT SOME MORE!!!