
Experts tell us that 90% of the Arctic sea ice has melted, and that it will be ice-free in a couple of weeks – which is why there is slightly less summer ice than there was during the peak years of the early 1980s.
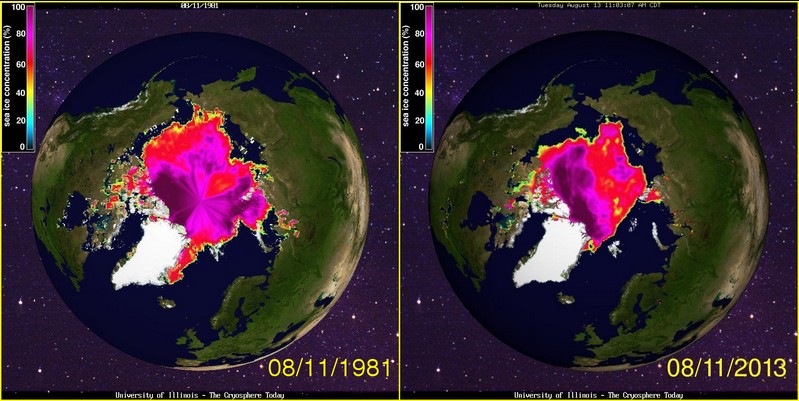
Experts tell us that 90% of the Arctic sea ice has melted, and that it will be ice-free in a couple of weeks – which is why there is slightly less summer ice than there was during the peak years of the early 1980s.

What a great comparison! Excellent choice of maps. I’m sure some will accuse you of “cherry picking,” but by showing that even back in 1981 the summer melt of sea-ice was considerable, you may just open a few people’s eyes.
Many people think the ice was all 40 feet thick back then, and I’ve been “educated” by some people that melt-water pools did not exist because the surface of the ice was “too rough,” whereas now it is smooth. In actual fact the researchers back then walked about with big boots in knee deep slush.
The entire effort to promote the idea that current summer melts are “Unprecedented” has involved a great deal of hyperbole. While this may be acceptable in creating writing it isn’t acceptable in science. The effort to accentuate the ice melt has involved exaggerating how icy the pole was in the past. Those exaggerations need to be exposed, and the real picture of what history has to show us needs to be seen. Your simple comparison of 1981 with 2013 does exactly that.
By the way, the “north pole camera’s” temperature sensor has shown temperatures below the freezing point of salt water for over three days now. Lowest temperature has been -4.7 Celsius; (23.5 Fahrenheit.) (see update at bottom of http://sunriseswansong.wordpress.com/2013/08/06/north-pole-camera-one-pictures-polar-bear-tracks/)
Here is The new pict from Canada env.
https://twitter.com/NJSnowFan/status/367429472384856065/photo/1
Much thanks. I’ll use that.
It would be interesting to see what that chart looked like during 1940 or 1950. 1981 was near the end of an unusually cold period.
I’m thinking that 1940s and 1950s were similar or less than what we have now. Stories from the artic from 1958 to 1963 seems to strongly suggest ice cover less than today. The thickness of the ice was also similar (2 to 3 meters) at the pole.