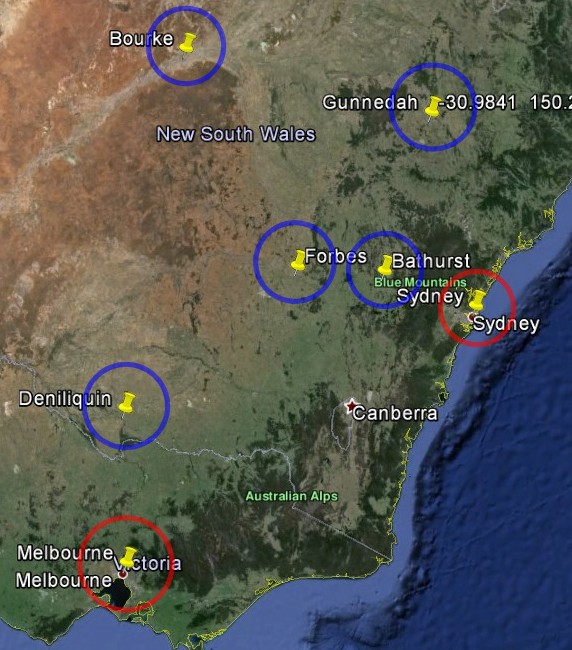
I did a survey of the ten oldest stations in New South Wales And Victoria, circled below. Three rural stations were not included because of obvious problems with the data, but none showed any warming.
MELBOURNE REGIONAL OFFICE ASN00086071 DENILIQUIN (WILKINSON ST) ASN00074128 BATHURST GAOL ASN00063004 SYDNEY (OBSERVATORY HILL) ASN00066062CAPE OTWAY LIGHTHOUSE GSN ASN00090015BOURKE POST OFFICE ASN00048013WAGGA WAGGA (KOORINGAL) ASN00072151FORBES (CAMP STREET) ASN00065016INVERELL COMPARISON ASN00056017GUNNEDAH POOL ASN00055023
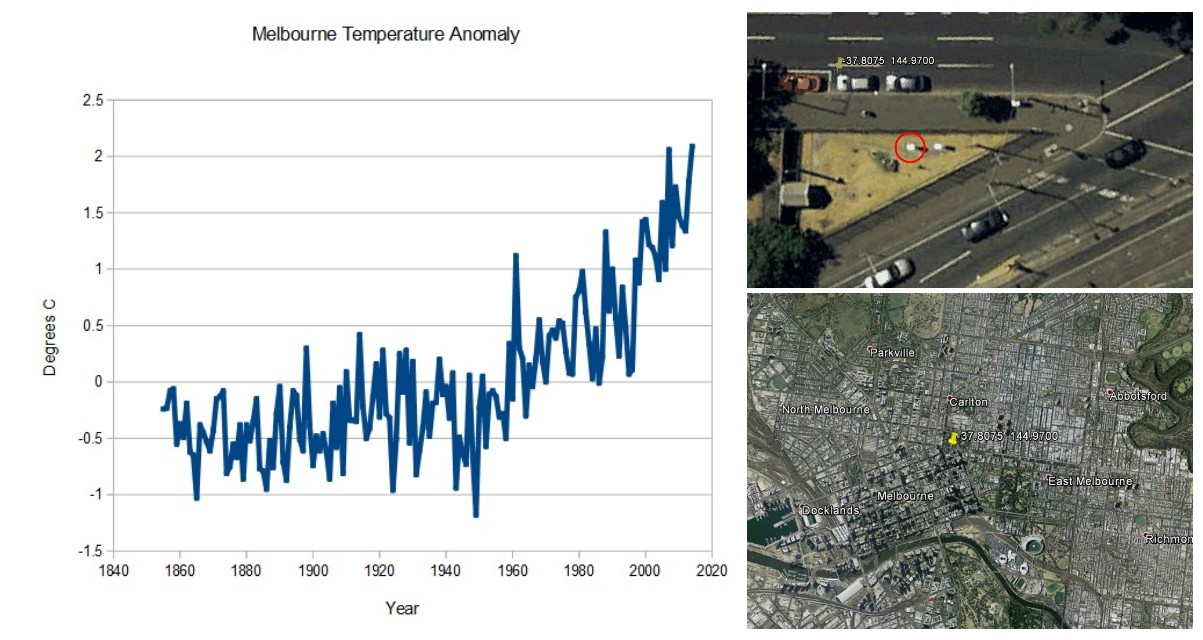
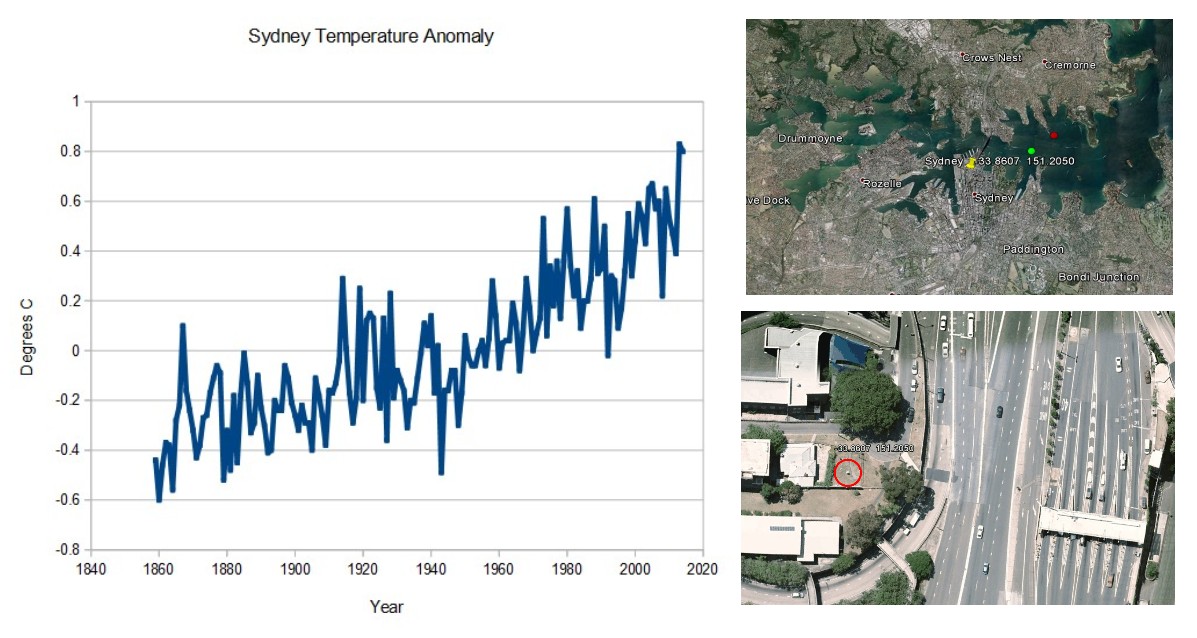
The two urban stations at Melbourne and Sydney both showed strong warming, and both have disastrously poor siting of their thermometers in the middle of large cities.
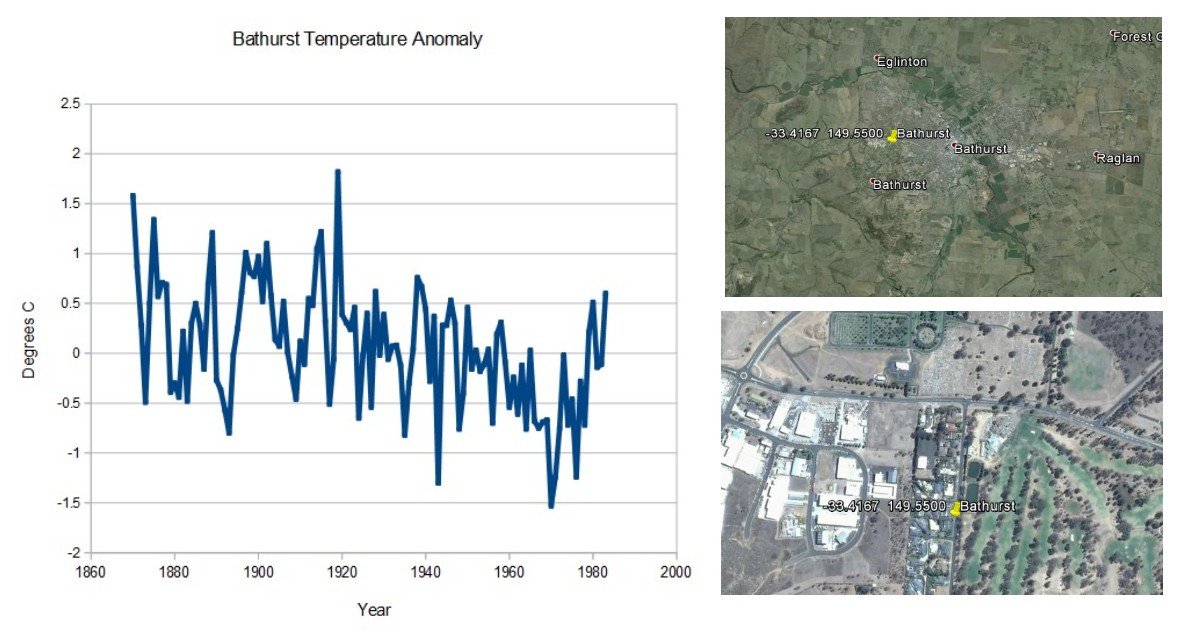
By contrast, all of the rural stations show a long term cooling trend, with some recent warming. (Note that there is no data for the most recent years with some of the rural stations.)
The only conclusion which can be derived from this is that Australia has not warmed long-term, and that BOM claims of record temperatures are due to UHI and/or data tampering.
For all GHCN stations in Australia, there is no net warming since 1880

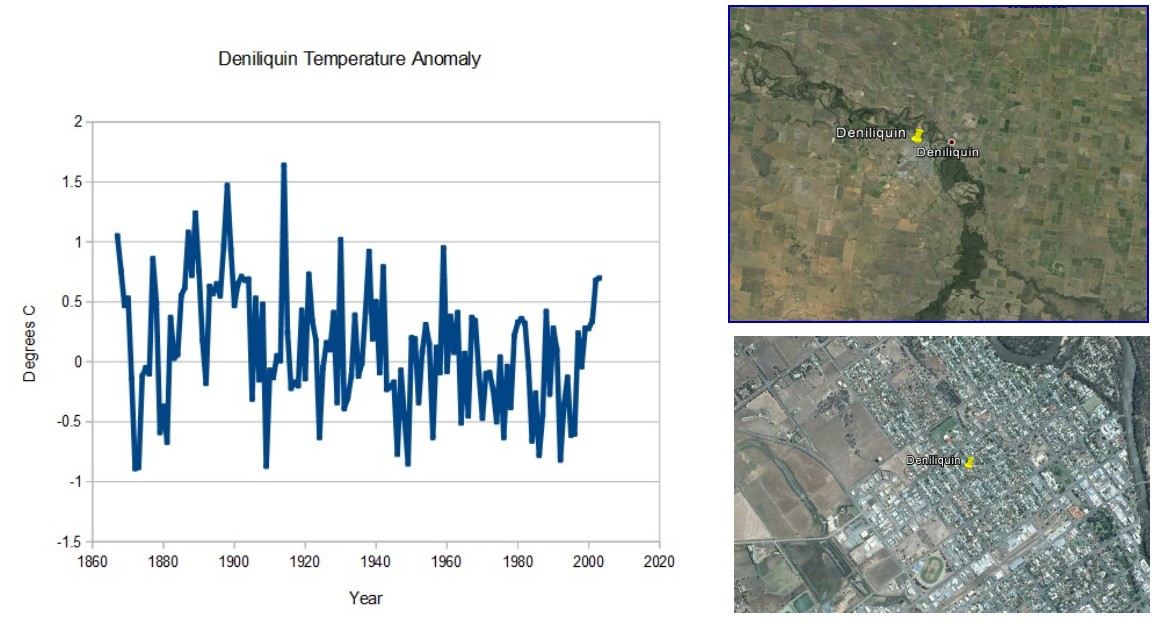
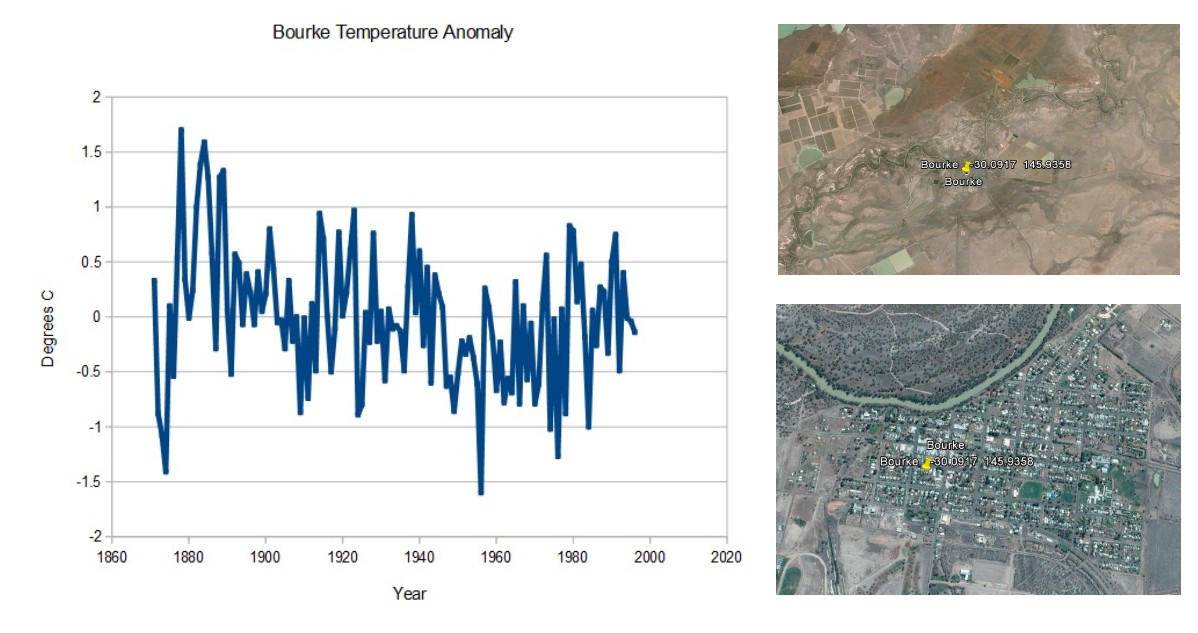
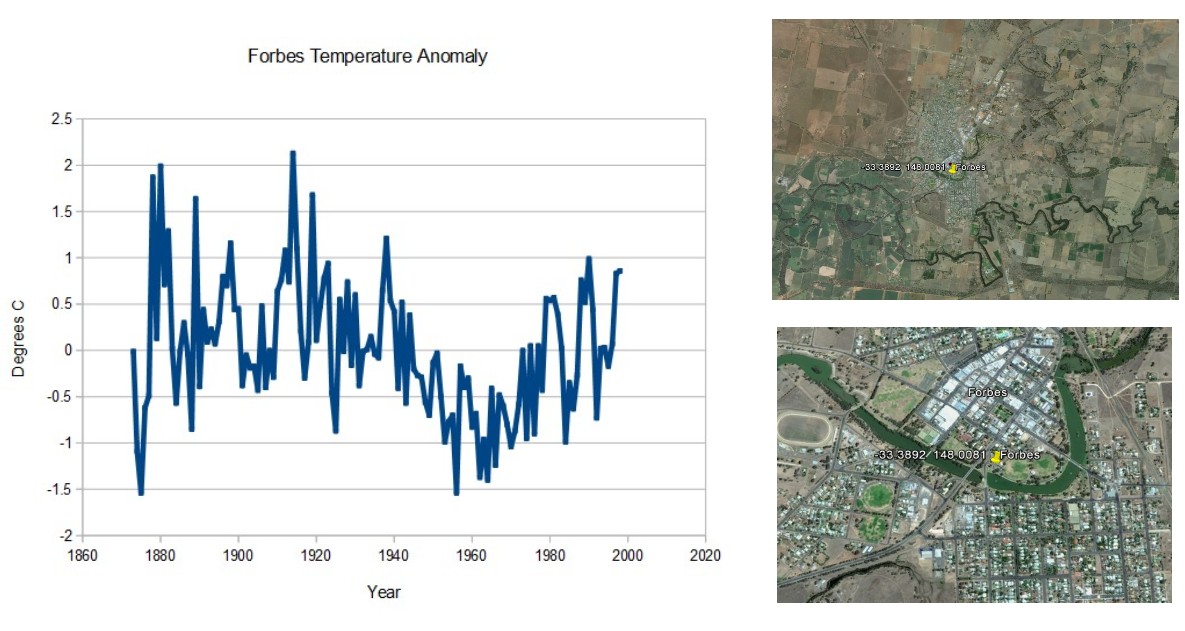
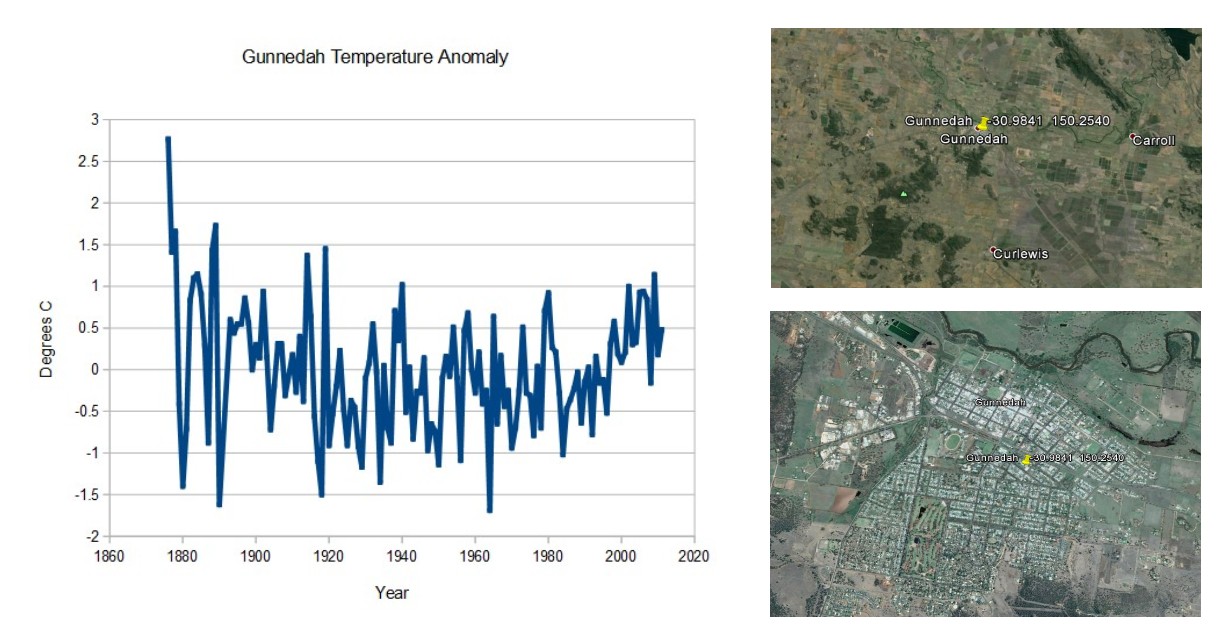
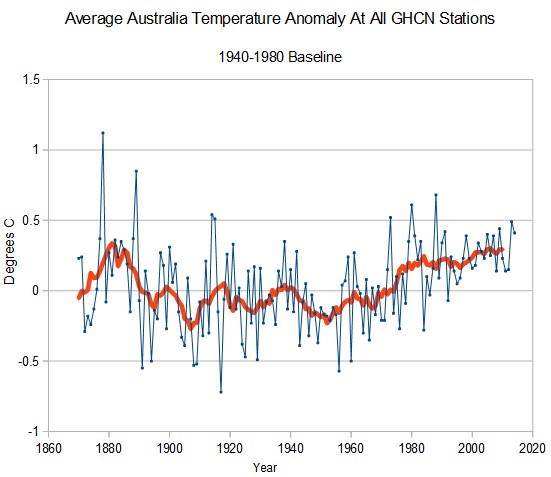

Blatant stupidity or blatant corruption of data… only 2 possible explanations. I choose the second one.
In his book Heaven and Earth, Ian Plimer cites studies indicating UHI can be substantial in towns of as little as 1000 population. One of the studies cited used towns in SE Australia (p. 384).
Most of the towns shown in the above maps could exhibit UHI effects, considering the stations appear to be near the population centers.
Anyone who has walked barefoot on asphalt knows that one road is enough to produce a substantial UHI effect.
And the pissed off DI says: “Front Lean & Rest Position. MOVE!” on the asphalt parking lot at Ft. Jackson, SC on a hot July day! Yes, it does get ones attention and a few doses of that treatment for the whole platoon sone gets the most recalcitrant recruit to fall in line one way or another.
At Fort Jackson (Columbia SC) you had better wear gloves in the summer or burn your hands on the ignition switch and steering wheel. It is the reason I decide to live in NC instead of SC, I don’t have to remember my gloves in the summer.
(Ex husband was a basic training officer at Fort Jackson.)
or even the difference between walking barefoot on dirt and grass….and even white sand on the beach
That wasn’t clear…….you can’t even discount what goes on in rural areas….the difference between a field planted….and a field turned over and just dirt…can easily be as much as 20 degrees
Concrete and asphalt are commonly used as ‘thermal mass’ in passive solar heating construction…but yet, ‘in the wild’ they have no effect on local temperature?
Steven,
I presume you are using GHCN-D min/max data of which they have about 1600 stations for Australia. I’ve been working with the GHCN-M(onthly) data. They only have 586 stations in their inventory, 10 stations for 1870. As of this year they are using 68. That’s down from a peak of 499 stations in 1975. In 1987 they dropped 112 stations and by 1993 they were down to 81 stations. They must be measuring temperature in some alternate universe or making cherry pie, I guess.
GISS relies on GHCN-M data in doing their analysis. One might get the idea the message is more important than reporting complete and accurate data.
Here’s a graphic of their data. http://oi57.tinypic.com/14e1g14.jpg
“[ … ] there is no data for the most recent years with some of the rural stations.”
They don’t want those cooling stations to contaminate the UHI of the city stations now would they?
By the way, we had a particualry warm day in Brisbane on Wednesday this week … about 30C due to warm NW winds. That 30C was measured in the city, meanwhile, the maximum daytime temperature measured at Brisbane Aero was 27C which is about 6km out of the city.
“particularly”