High and Low Temperatures | Climate Change | US EPA
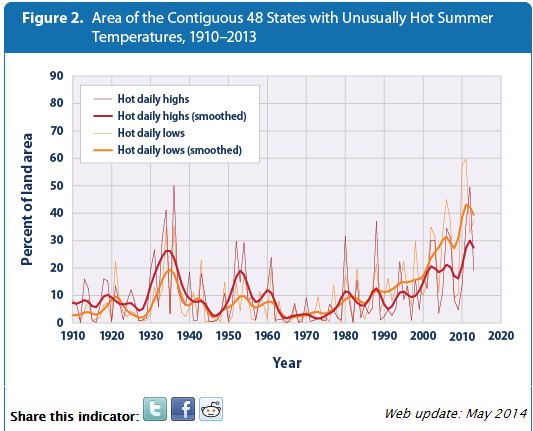
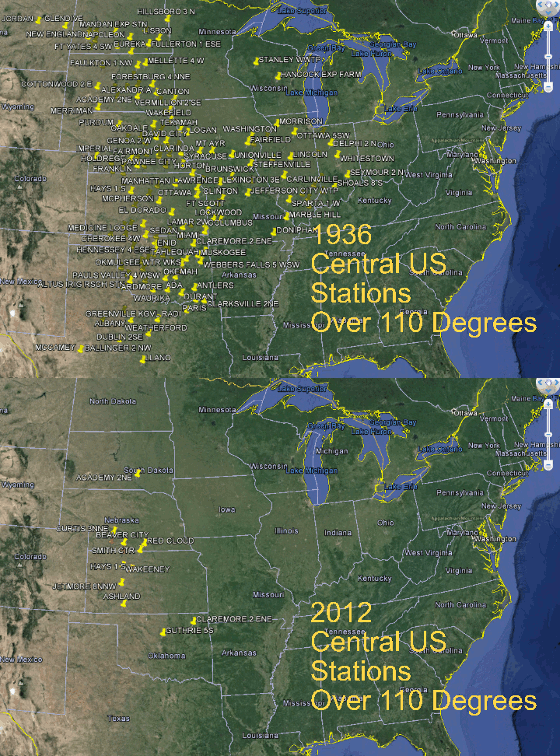
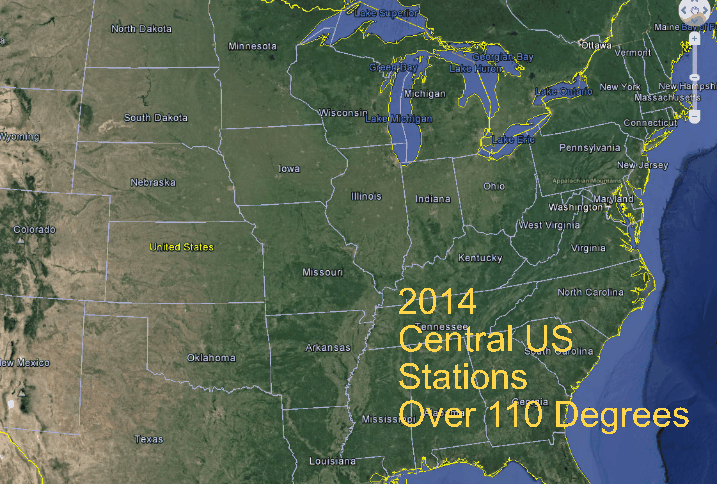
NCDC and EPA claim that hot summer maximums were more widespread in 2012 than they were in 1936. The animation below shows how spectacularly fraudulent those claims are.
2012 wasn’t even in the same ballpark as 1936. This is just blatant fraud.
There were no 110 degree temperatures in the central US this year.


I wonder if they are aware that the US is only 2% of the globe. I believe I read about that recently.
Have you read this?
Some real classic quotes.
“Global warming has doubled risk of harsh winters in Eurasia, research finds”
http://www.theguardian.com/environment/2014/oct/26/global-warming-has-doubled-risk-harsh-winters-eurasia-research-finds
Totally meaningless metric. Reported numbers are not spacial and therefore of no statistical meaning.
The only temperature that counts is the one that UAH reports and that number is telling us that CAGW is a myth.
What a stupid comment
I always enjoy the way you try to endear yourself to your commenters. So tell me, if tomorrow there are hundreds more high temperature records than in 1936 over the same area, yet UAH shows the temperature of the world has done nothing significant; is that a sign of CAGW? Does it matter what area is covered by the high temperature records? The alarmists are always telling us about any temperature record as if it has some significance. None of these temperature records are significant if the temperature of the world is not climbing, or not climbing at a catastrophic rate.
Well, if you’re talking about the NCDC graph, it is not meaningless, because if the numbers were real, it would indicate warming. But Tony showed in a previous post how they actually inverted the overall pattern of the data, somewhat like Mann did with lake varves.
http://stevengoddard.wordpress.com/2014/10/22/smoking-gun-of-massive-climate-fraud-at-ncdc-and-the-epa/
Well it’s because all the heat is hiding in the oc…., er, hiding. OK?
And that why it’s cooler beacause all the ice has been melt…, er, ummm, hiding the heat!
Hey Micky, and you too Gavin,
I got a new one for you – The heat is hiding in the ice.
That’ll work wouldn’t it?
Tom0Mason I just recently read that the heat is hiding under the newly formed ice…
Yep the idea that the heat is in the ice as believable as “the check is in the mail”. The problem is there is no ‘heat’ to go missing as the CO2 theory is just wrong.