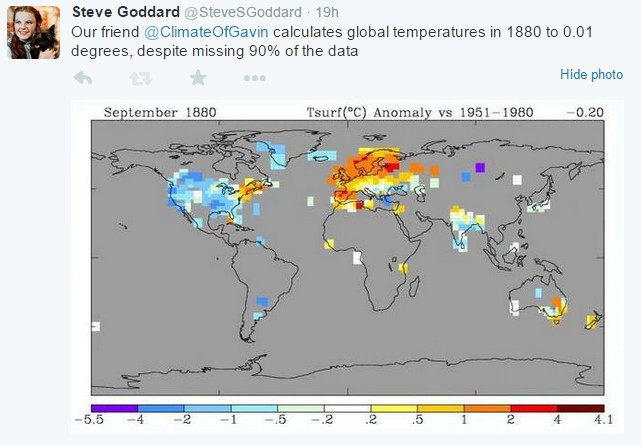
Yesterday on twitter I pointed out to Gavin that he calculates 1880 surface temperatures to 0.01 precision, despite not having any data for most of the land surface.
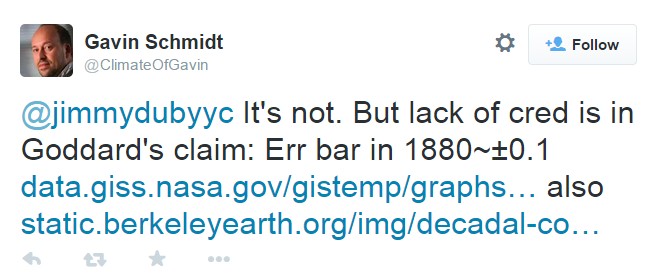
Gavin responded by claiming that his use of error bars means he is not calculating 0.01 precision.
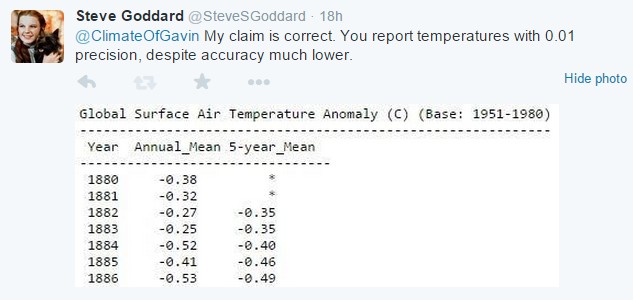
I responded with the GISS data, and showed that he is reporting temperatures to 0.01 precision.
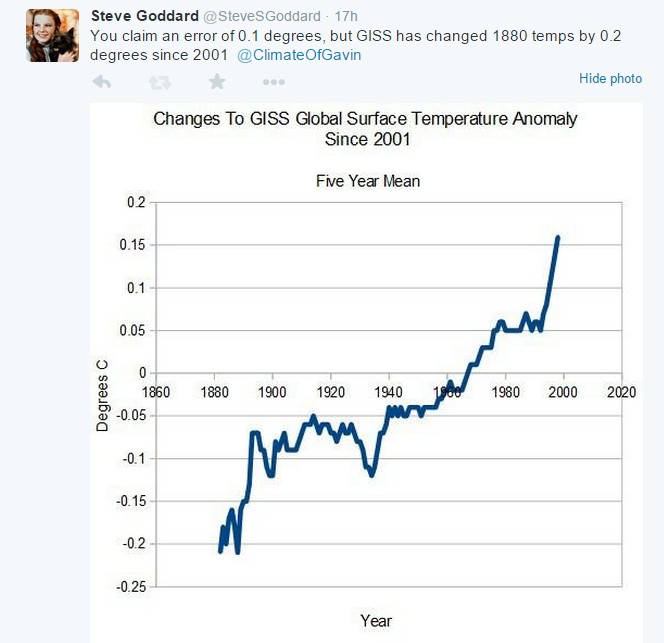
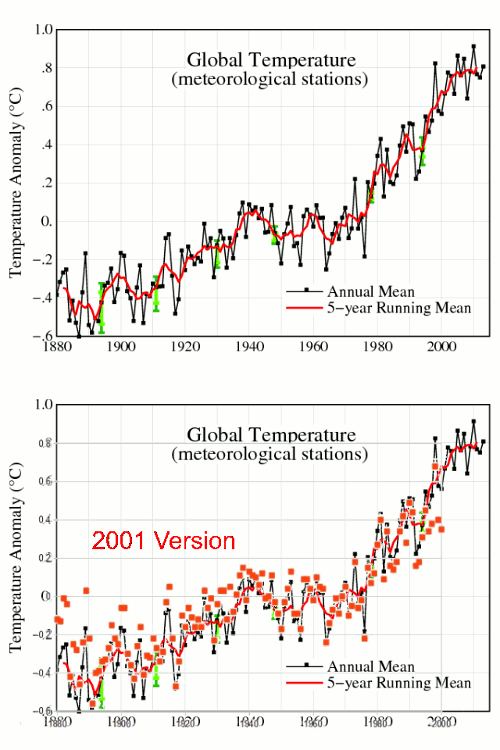
But here comes the real kicker. Gavin claims 0.1 error bars, but GISS has changed their own data by much more than that since 2001.
2001 version : wayback.archive.org/web/20010507……FigA.txt
The animation below alternates between the current graph with error bars, and the 2001 version. The points from the 1880’s are nearly 300% outside of Gavin’s top error bars.
They are adjusting the data by a much larger amount than their own error bars, which is scientific gibberish.
Everything about NASA temperature data reeks of propaganda. It doesn’t pass the most basic sniff tests as legitimate data. The error bars are meaningless green crayon.


I’d be curious about you opinion of Carl Mears in light of this article he wrote… http://www.remss.com/blog/recent-slowing-rise-global-temperatures
I would guess that he has come under pressure from the climate mafia.
It seems to me he is in lock step with Hansen, Mann, et al, despite his own RSS data.
He says that people who believe that RSS shows cooling are “climate change denialists”.
This is not the cooling you’re looking for, move along.
I am very disappointed in Carl Mears. He calls people names which not only shows his own bias & lack of open-mindedness, but also is 100% off the mark. The people he criticize are not climate change denialists and they are not cherry-picking. I see a lot more denying and cherry-picking in his writing than I do in those he dismisses.
Mears excuses the “pause” by blaming it on subduction to the deep ocean. But the most comprehensive study to date shows there ISN’T ANY “missing heat” in the deep ocean.
http://www.nature.com/nclimate/journal/vaop/ncurrent/full/nclimate2387.html
Saying the “missing heat” was hiding in the deep ocean was really the last straw they had to grasp at, to try to show their warming models had any kind of validity. And now even that is shot down. There is no “missing heat”. It doesn’t exist.
The models are invalid. It doesn’t get much simpler than that.
I guess more accurately I should say the heat is missing *because* it doesn’t exist.
People like him [arrogant; think they are never wrong], will never admit that THEY are wrong.
They will argue with you, or ignore you, or claim that you do not know what you are talking about.
IMHO…………..
AP science writer Seth Borenstein is very much on their side as well. He has no regard for any skeptical views of the CAGW hypothesis.
Nicely done Steven,
another 100% agenda scamster toady, living fat on public money, mouths off and reveals that he is a technical moron (+/- 0.1ppb), fraudulently getting paid for what has been shown he does not understand (100% +/- 0.0000000001 ppm).
About time for another distraction Gavin as everyone has notice how useless you are – again.
Seeing Tony’s exchange with Gavin reminded me of the video someone posted here recently in which Gavin refused to debate Dr. Spencer. Afraid to debate Spencer? Really?
Gavin’s courage must be proportional to his personal integrity.
“Green crayon”
First chuckle of the day.
Years ago I worked in metrology. One of our favorite sayings was “measure it with a ruler, mark it with chalk and cut it with an ax”. Gavin has reversed the order but kept the meaning.
Measure it with chalk, mark it with an ax, and cut it with a ruler?
1) Cut with ax (the data).
2) Mark with chalk (what you want the conclusion to be).
2) Then measure with a ruler (to report your “scientific” findings).
Thank you Richard for making that clearer than I could have. 3) probably should be “to report your very precise, 97% consensus “scientific” findings”
:- D
Tell any lie, invent any data, corrupt any graph. That’s how you keep a job at NASA GISS and eventually get promoted up the ladder. Because fear mongering on behalf of your bosses and providing our dullards in the media with screaming headlines is really the job.
There is a way to get some idea of the error bars for 1880. Take the 1880 coverage and get the temperature from RSS for 1980 and compare it to the full global temperature for 1980 from RSS. Take the difference. Repeat for 1880 vs 1981, 1880 vs 1982, to 1880 vs 2013. You get about 34 differences. The standard deviation of these differences will give an error bar. A histogram of the differences would also be interesting.
The error bar above will be a minimum error bar since it only accounts for lack of areal coverage. The real total error bar will be larger.
He claims error bars of 0.1C degrees for 1880 temperatures? … Do you honestly believe he can achieve that kind of accuracy while missing 90% of the data? Even 0.1C ? .. I would contend that he cannot achieve that sort of accuracy with 100% good data, let alone missing 90%. I would also contend that his 1880 could not possibly achieve accuracy within 1C, let alone 0.1C.
Thanks, I’ve pointed out repeatedly how ridiculous this is. Gavin said around 2004 or so that all the data was accurate to .1 degrees, even though nearly every temperature in the record has been changed by more than that since then.
Another day, another kicking. Excellent work.
Pssst…….. The missing heat is hiding on the Earth’s moon. Pass it along. LOL
I have often wondered how NASA scientists managed to be exempt from the rules on significant digits that I learned in grade school, and again later in Numerical Analysis classes.