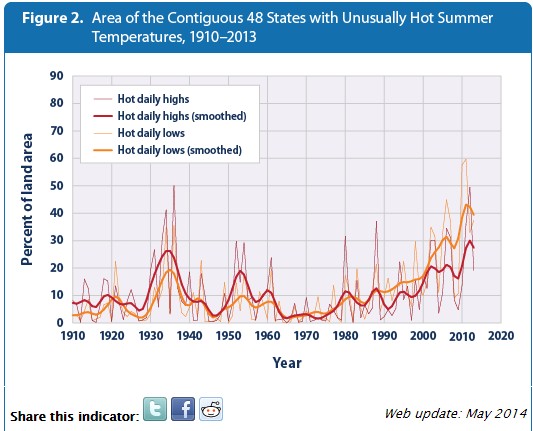
The EPA has this graph on their website, based on the NCDC Climate Extremes Index
It shows that the area of the US with hot daily summer temperatures is at record levels.
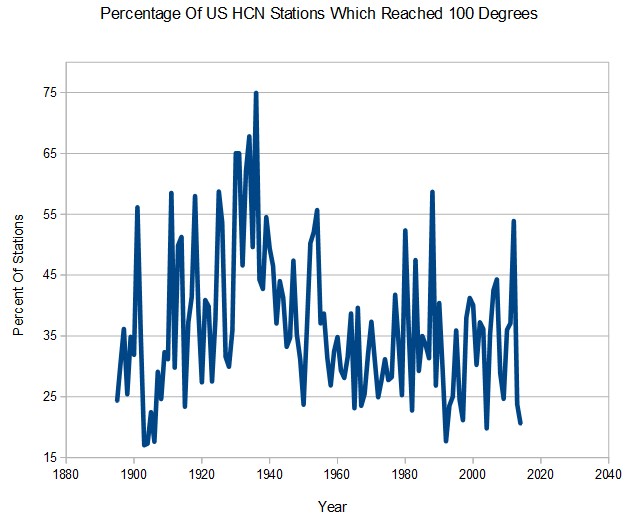
The graph is completely fraudulent. In fact it is inverted. Prior to 1960, the area of the US which reached 100 degrees during summer was quite a bit higher, and in 1936 seventy-five percent of stations reached 100 degrees. The percentage of the US reaching 100 degrees every year is much lower now, with 2014 close to a record low.
The EPA graph shows 2012 as the hottest, when in fact it wasn’t even in the top ten. They show 1936 at 50%, when in fact it was 75%.
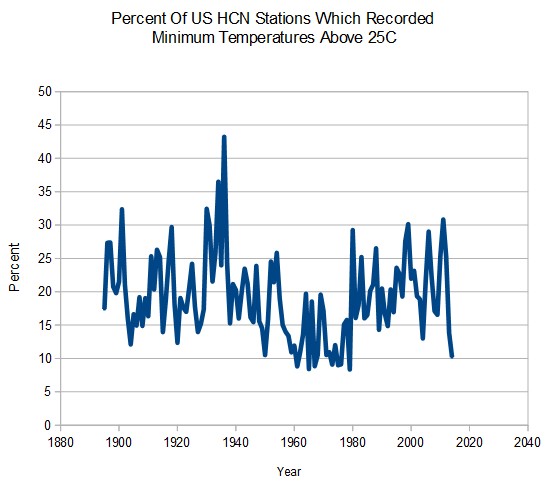
Next is the minimum temperature graph – again in sharp disagreement with the EPA graph.
This metric is not affected by TOBS or homogenization. Apparently the good people at NCDC are simply fabricating numbers, because I used their thermometer data in this analysis.


This new scandal is big news. I propose the name Upside-Down Karl. I will wait with baited breath for McIntyre to cover the story. (Actually, I won’t.)
RTF
bated
The slip is understandable as you were baiting him …
:- D
Yep… Smoking Gun and total Garbage….
Problem is if a gun fires a bullet… Smoke pouring out… But nobody is there to see it…. Was there really a smoking gun? Yep… Governmental Authorities across the Globe Publish this shit… And we pay for it… They dole out billions in Grants… Which we pay for… All to promote Global Warming and “extremes” cause by Mann made CO2….
This Blog does a great job of getting to the truth… But we all have a long way to go … Authority figures are lying and playing politics… Many are catching on… Still… Backed by Billions … Fighting Government Fraud is a huge uphill climb..
Absolutely stunning — though they have left themselves a little wiggle room. How long before someone points out that “the EPA graph shows area and your graph shows percentage of stations”! Of course, it will be useless to point out that one of the factors in choosing stations for inclusion into the HCN network was spacing, and that no honest person could reasonably compare the dust bowl years with recent years.
Arguing the facts with the CAGW cultists is pointless, because they have NO regard for the facts.
Area would be even worse, because of the higher density of stations on the East Coast – which has fewer 100 degree readings.
They even say in the side column-
“Heat waves in the 1930s remain the most severe heat waves in the U.S. historical record (see Figure 1)”
I have looked at all the state temperature data for 1936 and it is even worse than you think! I remember looking at Nebraska for example, seeing day after day with 115+ temperatures at many stations. The duration and geographic extent were also truly astounding.
EPA’s new head of sky-watching is …
http://www.climatechangedispatch.com/images/stories/cartoons/cartoon-epa-chicken-little.jpg
“no honest person could reasonably compare the dust bowl years with recent years.”
===============
why not?
Many skeptics of fraudulent climate change are unfortunately still trying to find the mistake by arguing the laws of thermodynamics.
I don’t argue the “laws” of thermodynamics, I question them. As any legitimate skeptic would do under such circumstances.
RTF
You “question” the Laws of Thermodynamics? … Which part of those “laws” do you consider to be in doubt?
Wow. Read my blog, and follow all the links.
Also read all the conversations at claesjohnsonmathscience.wordpress.com from the time that I was doing posts about it, ~2011/12 to when he took a break from that blog in 2012.
Science of doom will tell you.(sarc) I stopped talking because it is useless. I believe that Richard implied what happens with the laws. I’m not going to read your blogs Rich, I just don’t have time. However, I question the retention of heat being released in the upper atmosphere via thermodynamics and second, no where is there an explanation for the mechanical transport of heat by convection. The reference that CAGW gives is an old one, if you consider 17 or 18 years old when co2 concentrations were at least 20% less, incoming of 363 w/m^2, 240 w/m^2 retained and only 123 w/m^2 being released. Do the math and figure the tipping point. Whether that’s tripe or not, it is what the screams were about. “We Have To Take Action Now”… kind of stuff. So something is wrong with CAGW analysis of thermodynamics in the atmosphere. Other than fraudulent claims of hottest on record, nothing has happened. Glaciers didn’t melt, NYC is not swimming in 20 feet of seawater, the Arctic ice is growing, hurricanes declined instead of becoming more numerous and stronger, The Great Drought in the Midwest ended, the Great Lakes froze over and snowfall increased along with a very cold winter. So the argument that the analysis that this point of view is wrong is based on what? CAGW interpretation of how thermodynamics works? Reality would suggest that CAGW’s interpretation is wrong.
Meanwhile, the EPA is in the process of closing the most reliable source of electricity from coal fired plants, and is now going after farcing. God forbid that the US should become energy self sufficient. Not that if the co2 levels remained the same from the year 2000, the current temps are below the lowest estimates of temps by the IPCC. And what cost to achieve either a minimum result or, in this case, reality, none at all. My question, “Where’s the freaking heat hiding?” .
— Arnold Sommerfeld (1868-1951), physicist.
in Hoffman, J., C. Johnson, and M. Nazarov (2012). Computational Thermodynamics.
— Thomas Henry Huxley (1825-1895), ibid.
One more, and I’ll stop:
— Erwin Schroedinger (1887-1961)
Stop! Sommerfeld and Schrödinger didn’t understand the fundamental scientific principle of settled science. That’s expected from foreigners who didn’t have the benefit of modern American public schools.
I’ll check your blog. I’d really like to understand the argument and to date I have not found anyone who can clearly articulate the science or the stance. Hopefully, your blog will provide some new information.
(PS I’m not a spam bot! I just type like one early in the morning!)
I think you’ll find some things there that will truly challenge your thinking. Whether it’s all correct or not, only time will tell. But I have spent a huge amount of time trying to sort through it, and identify problem areas in the generally accepted theories. To clarify what I said before: the conversations at ClaesJohnsonMathScience.wordpress.com were from the months of 2011/12 – 2012/03. Much of what I contributed, I have not yet linked at my blog (richardtfowler.wordpress.com) but eventually I plan to do more.
RTF
In looking back through those conversations, it seems to me that a number of them may have been deleted. However, I did save the great majority of them. So once I have time to go back and figure out what was deleted, I will be able to post on it. In the meantime, there’s still enough there to make for very interesting reading.
RTF
Some heads should role
Well there’s smoke from something…
http://climatechangedispatch.com/images/stories/cartoons/Cartoon_-_Climate_Science.png
Above 100 degrees is the daytime temperature. I thought the most warming showed up in higher nighttime temps?