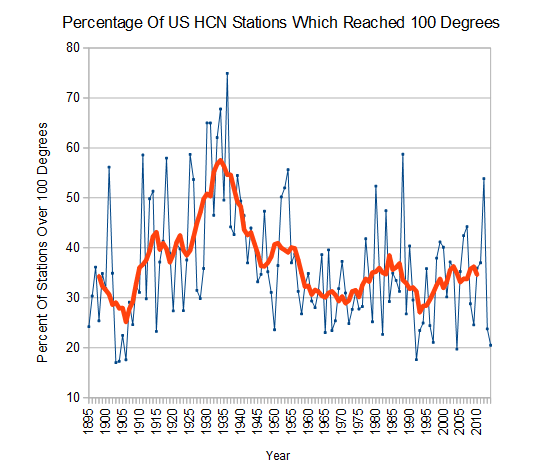
NCDC and EPA show the areal coverage of US heatwaves increasing, when in fact it is doing the exact opposite.
http://www.epa.gov/climatechange/science/indicators/weather-climate/high-low-temps.html
The graph below is the actual NCDC raw data. It shows the opposite trend of what these same government agencies tell the public.
They can’t claim time of observation bias, because it has no impact on this metric.


Reblogged this on BLOGGING BAD w/Gunny G ~ "CLINGERS of AMERICA!".
The cheating on the temperatures is no longer trying to be hidden or even explained away. It is their last desperate attempt.
Big Brother has met his match: TRUTH !
Hail Mary graphs?
Your ability to turn a phrase always brings a smile.
Science fraud became public policy after 1945 to hide the source of energy that destroyed Hiroshima.
The best available experimental data from the Nuclear and Space Ages show the same force in the core of the Sun, a PULSAR that:
1. Made our elements
2. Birthed the solar system 5 Ga ago
3. Sustained the origin and evolution of life on Earth after 3.5 Ga ago.
4. Now mantains dominant control over every atom, life and world in the solar system, a volume of space greater than that of 10,000,000,000,000,000,000 Earths!
Now five years after Climategate emails surfaced in Nov 2009, I am convinced modern society can only be restored to sanity (reality) by a miracle like that David requested in Psalms 57 when overwhelmed by forces of evil:
“Show your greatness in the sky O God, and your glory over all the earth.”
I note that the graph from EPA uses two metrics different from Goddard’s. First, they are using hot daily records (over what time frame?), and secondly, they use % of land area rather than stations. This, of course, allows them to smear averages to get the warming results.
Summer, like it says on their graph. My method is conservative. Using land area would make their fraud even worse.
Yes, i understood they are looking at summer temperatures. But this part is vague (from EPA):
“The term “unusual” in this case is based on the long-term average conditions at each location.” So hot is not necessarily a record, just exceptional.
Whereas your graph sets a clear definition of 100 degrees.
It would be impossible for whatever you are proposing to be divergent from what I have shown
To be clear. I prefer your analysis; it is exact and unequivocal.
I am interested to see how EPA and NOAA work their magic. For instance, they say this:
“In each case, we define much above (below) normal or extreme conditions as those falling in the upper (lower) tenth percentile of the local, period of record. In any given year, each of the five indicators has an expected value of 20%, in that 10% of all observed values should fall, in the long-term average, in each tenth percentile, and there are two such sets in each indicator.”
http://www.ncdc.noaa.gov/extremes/cei/definition
It looks to me that their definitions allow them to proclaim weather extremes every year.
The chart by EPA (Figure 2) of “area” seems to show a night time urban heat effect. Look at the thick yellow line – Hot daily lows (smoothed). The mid-1930s peak was just under 20%. The recent peak, 2013-?, seems to be about 44%. Meanwhile, the thick red line for the same times seems to have changed by about 3 (27 to 30).
With all the other known issues with the temperature record the EPA ought to find more important things to do. Each year they could eliminate 20% of the current number of employees. That would be helpful.
This election will put the environmental whack jobs out of business for the next two years, hopefully the 2016 election will put them out of business for good.
I hope your conclusion from the election is valid.
However, Republicans have had the majority on the Congressional Space Science & Technology Committee for several years and failed to use their majority to end deceitful science in government.
Again, I hope your conclusion is valid but I doubt if Republicans have the fortitude to correct seven decades of government deceit about the source of energy that powers the Sun and sustains our lives.
I’ve only been in Washington a few months. Give me time.
Gladly! And I’ll do whatever possible to provide any technical assistance that I can. This is not my personal mission, but the mission of many good scientists who’ve passed from the scene of life, including my research mentor – the late Professor Paul K. Kuroda aka Kazuo Kuroda of the University of Arkansas and the Imperial University of Tokyo:
01. P. K. Kuroda, My Early Days at the Imperial University of Tokyo autobiography http://www.omatumr.com/abstracts2005/PKKAutobiography.pdf
02. P. K. Kuroda, “On the nuclear physical stability of the uranium minerals,” J. Chem. Physics 25, 781 (1956); “On the infinite multiplication constant and the age of the uranium minerals,” J. Chem. Physics 25, 1256 (1956).
03. P. K. Kuroda, The Origin of the Chemical Elements and the Oklo Phenomenon (Springer Publishing), 165 pages (Dec 1982):
http://www.amazon.com/Origin-Chemical-Elements-Oklo-Phenomenon/dp/3540116796
04. P. K. Kuroda, “The Oklo phenomenon,” Naturwissenschaften 70, 536-539 (1983): http://www.springerlink.com/content/n556224311414604/
Like David, you have the courage and wisdom to see the power in a small stone instead of running from the false illusion of power bin Goliath.
Correction: “instead of running from the false illusion of power in Goliath.”