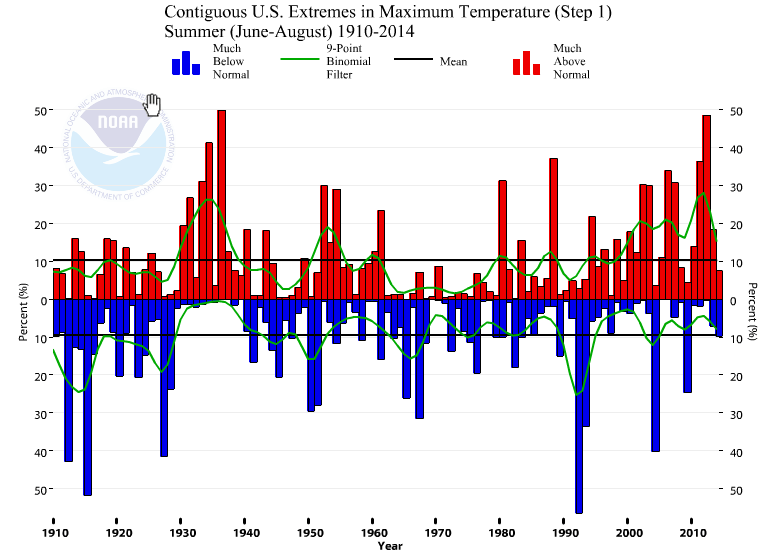
NCDC engages in all kinds of climate fraud, but none worse than their Climate Extremes Index.
percentage of the United States with maximum temperatures much above normal
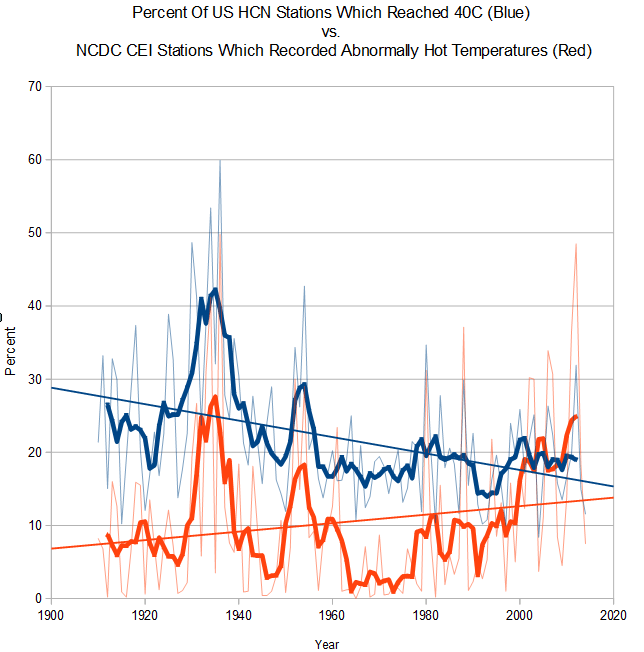
Compare this vs. the actual NCDC thermometer data, which shows that the percentage of the US with abnormally hot summer temperatures used to be much larger. I chose 40C as my reference, because it normalizes somewhat with the recent CEI years.
The CEI is 100% fraudulent, and important to note that this data is not subject to TOBS or homogenization. There is no way for them to explain this away with their standard excuses.


Meanwhile…Denver shatters cold temperature records…
http://www.denverpost.com/weathernews/ci_26921046/denver-weather-record-cold-snow-tap-wednesday
My labs won’t even go outside it is so cold. Was up to 17F on the way back down at noon.
Having a cut off like 40 does create an artificial trend even of maximum temperatures are just a tenth of a degree off. While not physically meaning full, how about squaring the difference between the maximum and the August average for the station. 10°C above comes out 100 times worse than 1°C above and 15°C above is twice as bad as 10°C above. I did something similar for Adelaide. Here is the sum for the summer months that shows a lull in the mid 20th century except for a few years that were worse than recent years (which are at a new station that reads higher by around 1°C for 40+ than the old site). http://postimg.org/image/vvng67r37/
CEI is a measure of geographical area of stations with very hot temperatures. Your approach would not be appropriate for that
annieoakley: 17F is a heat wave.
No. 17F is a sign of AGWing. It’s playing out exactly as the computer models predicted, don’t you know?
By November 19th, the high here will be 29 degrees F and 19 degrees F at night! This cold wave will last nearly 2 weeks…all the weather starting tonight going to be January weather.
And our President (sic) talks only about global warming. The Chinese are laughing all the way to the bank after he signed our death certificate, promising to strangle our economy for them.
Fortunately, nothing he sid or said is binding. It was a diversion to change the headlines. Like most things the T in C says. It’s just hot air.
Request: I am not a full time user of met data, and get a “bit” lost with all the acronyms. I’ve tried to Google them to get the full name, but that doesn’t work too well. Could you provide a list of them with their ‘translations’? Thanks
HCN or US HCN
H= Historical
C = Climate
N = Network
NCDC
N = National
C = Climate
D = Data
C = Center
If you put NOAA before the acronym you usually can find info on the data Steve uses.
40C days in the US are a thing of the past. All consistent with a warming planet (sarc).