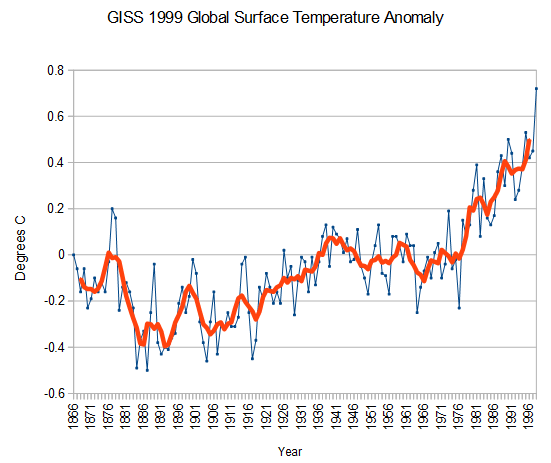
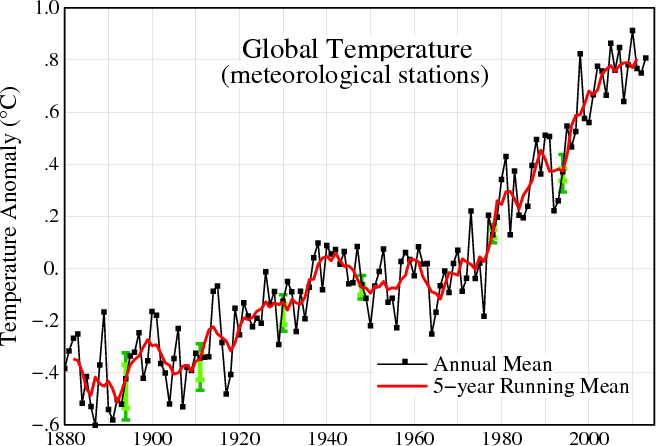
In 1999, NASA GISS showed about half a degree warming since the middle of the 19th century
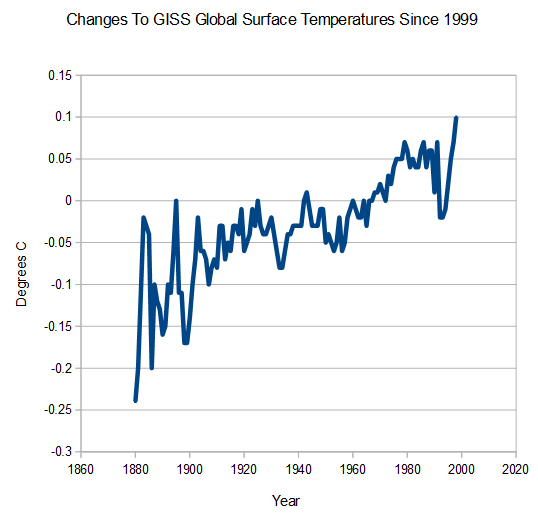
GISS now shows more than double the warming they showed 15 years ago.
Gavin accomplished this remarkable feat by progressively cooling the years prior to 1967, warming the post 1967 years, and disappearing the warm years prior to 1880.
If the present refuses to get warmer, then the past must become cooler.


No corrupting here in Canada with the Norfolk County, Ontario record. The high record is 21 C set in 1945. The cold record is -8 C set in 1976, the year Lake Erie froze over early and we got that nasty blizzard in 1977.
Now that was silly..
They missed one, and now you draw it to their attention !!
Didn’t Lake Erie freeze over solid in 2014 as well…
Yep… Cold as hell.. Cold as 77′.
It may be even worse. Are we able to verify that the 1999 graph (first above) is “correction” free?
Well since temps are flat for UAH and RSS from that period, and when compared to the NAS and other charts from the 1970s, and compared to the max temperature record…it’s been adjusted also.
I suspected as much, thanks for confirming.
The 1999 graph was already highly corrupted
GISS has rendered surface temperature records utterly useless. Shame.
Something tells me there was some good signal in there somewhere; but once Climate (so-called) Science became a political movement back in the late 1980s, all serious work ceased.
Really, really a terrible waste from the standpoint of science, leading to horrific public policies.
I would just like to see Gavin et. Al explain that one thing to Inhofe.
If you are American, then contact Inhofe and ask him to do just that.
Yes now would be an great time for as many US residents to contact Jim Inhofe with this request and examples of corruption of the temperature records. http://www.inhofe.senate.gov/contact
Steve has very many excellent postings showing this very clearly.
Thanks, Alan, for supplying that link and thank you, Steven, for showing the corruption of global temperature records at NASA.
It’s natural to think of this as a crisis in math and sciences but the true cause is Progressive English instruction in our public schools. Orwell wrote “1984” as a warning. Schmidt read it as an instruction manual.
Office of Inspector General
NASA is just a Whitehouse puppet, with no one of courage or conviction left in the hollowed out institution. NASA reckless idiots give aid and succor to Obama’s assertion that energy costs must ‘skyrocket’.
So remind me, why exactly do energy prices have to ‘skyrocket’?
Regretfully NASA has allies in most, if not all, federal research agencies that agreed after WWII to hide the source of energy in cores of :
1. Heavy atoms like Uranium
2. Some planets – like Jupiter
3. Ordinary stars like the Sun
4. Galaxies like the Milky Way
5. Our expanding Universe . . .
NSF, DOE, EPA, GISS, etc., ad infinitum
Thank you, Steven, for having the insight and the courage to confront those who corrupt-science-for-pay.
The path back to sanity will be a return to the historical reality, truth and God of our ancestors.
https://dl.dropboxusercontent.com/u/10640850/Yellow_Lark's_Prayer.pdf
FEAR induced social insanity in 1945:
https://dl.dropboxusercontent.com/u/10640850/CHAOS_and_FEAR_August_1945.pdf
Only FAITH will restore contact with:
1. Reality
2. Truth
3. God, or
4. Great Spirit
https://dl.dropboxusercontent.com/u/10640850/Yellow_Lark's_Prayer.pdf
The lines plotted on the Y axis range +/- .5 C. If you plotted these anomaly values on a real graph of actual min/max temperatures they’d be nothing but trivial wiggles. Lost sight of the forest for obsessing over the number of needles per twig.
Yep… This is corrupt Progressive Science…