Another Day Of Decadal High Arctic Sea Ice Extent

Arctic sea ice extent continues its march into record territory for the past decade.ScreenHunter_5487 Dec. 23 04.27
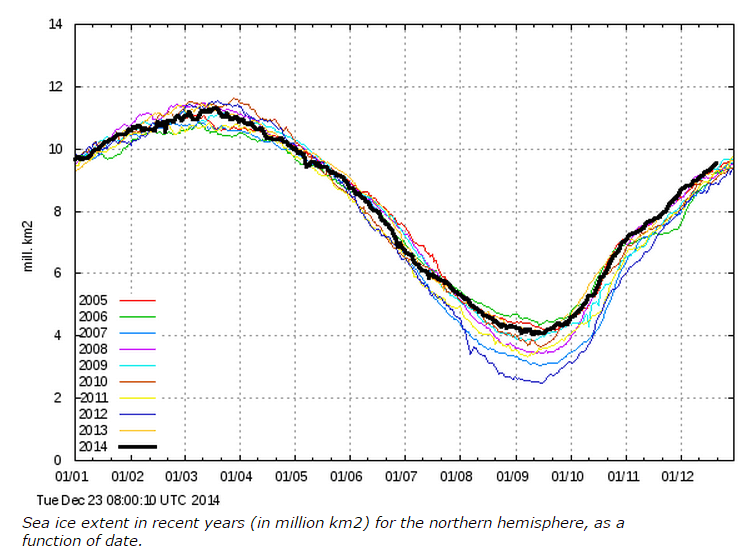
ScreenHunter_5490 Dec. 23 04.31ScreenHunter_5489 Dec. 23 04.30

Ocean and Ice Services | Danmarks Meteorologiske Institut

Four years since Mark “Death Spiral” Serreze predicted a record low in 2010, and I was a denier for disagreeing with him.

ScreenHunter_5492 Dec. 23 04.39 As Arctic sea ice shrinks faster than 2007, NSIDC director Serreze says, “I think it’s quite possible we could “break another record this year.” | ThinkProgress

About Tony Heller

Just having fun
This entry was posted in Uncategorized. Bookmark the permalink.

23 Responses to Another Day Of Decadal High Arctic Sea Ice Extent

  1. renbe says:

    And another day of melting glaciers and melting land ice on Greenland and Antarctica. Sea ice, by the way, does not influence the water level, melting land ice does…

    • gator69 says:

      And another day of moronic postings from natural climate change deniers.

    • Gail Combs says:

      Melting land ice in the middle of winter??? OH Noes!
      Of course it would have to get above freezing and the current high temperature in Greeland is Ikermiuarsuk, Greenland 26 °F
      Of course on the low is Summit, Greenland -61 °F

      Antarctica melting? Oh yes melting because of geothermic heat. It is in a volcanically active area as is the Arctic.

      Researchers Find Major West Antarctic Glacier Melting from Geothermal Sources

      Volcanoes Eurpt Beneath Arctic Ice

      NASA: Arctic Sea Ice

      Natural Variability

      …..On time scales of years to decades, the dominant cause of atmospheric variability in the northern polar region is the Arctic Oscillation (AO). (There is still debate among scientists whether the North Atlantic Oscillation and the Arctic Oscillation are the same phenomenon or different but related patterns.) The Arctic Oscillation is an atmospheric seesaw in which atmospheric mass shifts between the polar regions and the mid-latitudes. The shifting can intensify, weaken, or shift the location of semi-permanent low and high-pressure systems. These changes influence the strength of the prevailing westerly winds and the track that storms tend to follow.

      During the “positive” phase of the Arctic Oscillation, winds intensify, which increases the size of leads in the ice pack. The thin, young ice that forms in these leads is more likely to melt in the summer. The strong winds also tend to flush ice out of the Arctic through the Fram Strait. During “negative” phases of the oscillation, winds are weaker. Multiyear ice is less likely to be swept out of the Arctic basin and into the warmer waters of the Atlantic. The Arctic Oscillation was in a strong positive phase between 1989 and 1995, but since the late 1990s, it has been in a neutral state….

      Photo from the article shows ice being driven out of Bering Strait

      http://earthobservatory.nasa.gov/Features/SeaIce/images/bering_strait_sea_ice.jpg

    • catweazle666 says:

      It’s winter, dimwit.

    • Robert Balic says:

      If anyone struggles to follow the science at least understand the psychology. Years ago, I had to explain that the melting of floating ice doesn’t raise see levels to a passionate CAGW believer. They felt stupid so now they throw it back.

  2. emsnews says:

    Yes, isn’t it amazing how these guys see melting ice while standing in the middle of a blizzard.

  3. Sparks says:

    Looking at these polar graphs over the years, I’m convinced that Ice variability in what ever form, is controlled by earths orbital parameters, there’s is also a correlation between the expansion and contraction of the solarsystems planetary orbits, and a correlation between solar activity increasing and decreasing in the timing of the suns polar magnetic field reversals that correlate with the solarsystems orbital parameters.

    I haven’t seen any evidence that Ice formation on earth is controlled by fluctuations in atmospheric composition. regardless of the cause.

  4. Send Al to the Pole says:

    Fifty bucks says Serreze and his band of zealots (death spiral barbie, etc) will be posting graphs showing current levels below the 30 year median even after the satellite photos have ice beyond the orange line everywhere.

    • Gail Combs says:

      No takers. We already know they are a band of lying thieves and the MSM protects their backsides.

      Heck despite the brawls in NYC and two officers in the hospital the lying MSM is calling the NYC protests ‘peaceful’ with no violence.

      At least five officers have been assaulted by protesters — including two leitanents … a police barricade and some tossed garbage cans at police cars.

      a group of protesters surrounded a pair of traffic agents in a marked police car and smashed the rear window with a trash bin and a side window with a metal pole.

      Poet and adjunct CUNY professor who attended Harvard… was charged with assault, weapons [hammers] and marijuana possession, resisting arrest and rioting.

      This is a real goody:
      http://www.nydailynews.com/new-york/anti-police-remarks-dispute-911-center-sources-article-1.2054253

      Seems a 911 operator said “The cops deserved it. as they lay dying.”

  5. Robert Balic says:

    http://ocean.dmi.dk/arctic/icecover.uk.php

    The ice extent has been adjusted. Its not back to the mean after all. Who would have thought.

  6. Dmh says:

    There are good chances that we’ll be back to pre-2005 levels in 2015
    http://arctic.atmos.uiuc.edu/cryosphere/IMAGES/seaice.anomaly.arctic.png
    with anomalies not smaller than -1 million km2.

    • Gail Combs says:

      I think what happens will depend on the Atlantic Multidecadal Oscillation and when it switches to the cold mode.

      An old WUWT from four years ago: The Atlantic Ocean via the AMO drives the apparent “Global Warming” By Joseph D’Aleo

      • Gail Combs says:

        A better overall view: icecap.us/docs/change/OceanMultidecadalCyclesTemps.pdf

        • Send Al to the Pole says:

          In one of Bastardi’s recent reviews, he noted the past pattern with that switch includes a false start for a year or two, perhaps a year that looks warm again, then the flip. If that happens again, the gains in extent we’re seeing these last two years might recede a bit before coming back in force.

        • Gail Combs says:

          This is from Jun of this year. Since I live on the east coast I notice all that warm water jammed against the USA east coast lately.

          Joe has sent me a comment providing more information about the AMO, etc:

          “The latter stages of the warm AMO, when cooling starts in the North Atlantic, is when the warmest water is near the coast. This is not the cool AMO, rather it’s the transitional phase that is starting now. At the end of the warm AMO, the warmest water is near the east coast, just as we saw in the 1950s. By the 1960s the expanding pool of colder water, and the end of the last Arctic ice melt of the 1950s, were taking over. That then proceeded to have ice at high levels through the early 1990s. But as soon as the AMO flipped, the Arctic ice decreased.

          The linkage is this: The jamming of the warmest water up near the east coast in the waning stages of the warm AMO (example the 1950s) heightens the east coast threat, and is a sign the cold AMO is around the corner, and with it the end of the scam.

          It should be obvious now…one season of cooling and the summer ice melt will be weakest since the end of the cold AMO. The cold AMO is not the reason for increased east coast hurricanes. It’s the end game of the warm AMO that is telegraphing the coming cold. Look at the classic signature of the warm AMO 1997-2013 and you notice the water has been slightly cooler near the east coast, opposite the cold AMO signature of 1981-1996. The end game, when water starts to cool in the north Atlantic (and ice increases as we are seeing) has the warmest water jammed near the east coast. Please read http://patriotpost.us/opinion/26136

          The set up now is the sign it’s about to end and with it the reversal.
          http://notrickszone.com/2014/06/01/meteorologist-joe-bastardi-not-going-to-have-to-worry-about-the-arctic-ice-arctic-scare-melting-away/

          You can see that warm water even now:

          http://www.ospo.noaa.gov/data/sst/anomaly/anomwnc.gif

        • Dmh says:

          Thanks Gail, I didn’t know about this feature of the final phase of the warm AMO, with increased warmth in the east coast.
          It’ll be interesting to watch it from now on.
          The main point of my previous comment was the possibility of shortening of the period of the oscillation (positive AMO), correlated with low solar radiations.

      • Dmh says:

        I agree, Gail, my comment was in part based on J. D’Aleo’s analysis.
        I’m also betting in a considerable lowering of solar radiations– assuming that the solar max lasted from the end of 2011 to now– but this is the real difficult part to predict.
        I’m convinced that the present solar cycle is quite low.
        Despite the spike of intensity this year, it was not enough to change the general trend back to warming or even neutral. In particular, it could not change the trend of ENSO, which I consider an important parameter for solar forcing.
        Earth’s climate is still cooling, with great prospects of acceleration during the decline phase of the solar cycle.
        The relatively low level of radiations seem to be altering the Atlantic anomalies already and could possibly shorten the usual period of the positive AMO for many years.
        One problem that I usually notice with the analyses of good meteorologists, like J. D’Aleo and J. Bastardi, is that they don’t talk much about the Sun, and this limits their conclusions to some extent (IMO).
        Even using the correlation with the AMO, the recovery of the Arctic ice in the last 2 years could be another indication of the AMO starting to flip.
        It’s not a recurrent argument IMO, because the whole system probably works self-consistently and, as far as I can tell, it’s strongly correlated with the radiations too.
        As someone said once, we live in the “breath” of the Sun. We cannot forget this.

        • Gail Combs says:

          Dmh, The energy going into the oceans comes from the sun. But there is a group often seen at WUWT that think the ocean osscillations are completely internal and have nothing to do with any outside forcings.
          From the poking around I have done on the subject, it looks like one possible connection is :
          ? UV====> ? ozone
          ? ozone ===> ? Quasi-Biennial Oscillation

          Abstract.
          We investigate an apparent inconsistency between two published results concerning the temperature of the winter polar stratosphere and its dependence on the state of the Sun and the phase of the Quasi-Biennial Oscillation (QBO). We find that the differences can be explained by the use of the authors of different pressure levels to define the phase of the QBO.

          We identify QBO and solar cycle signals in sea level pressure (SLP) data using a multiple linear regression approach. First we used a standard QBO time series dating back to 1953. In the SLP observations dating back to that time we find at high latitudes that individually the solar and QBO signals are weak but that a temporal index representing the combined effects of the Sun and the QBO shows a significant signal. This is such that combinations of low solar activity with westerly QBO and high solar activity with easterly QBO are both associated with a strengthening in the polar modes; while the opposite combinations coincide with a weakening. This result is true irrespective of the choice of QBO pressure level. By employing a QBO dataset reconstructed back to 1900, we extended the analysis and also find a robust signal in the surface SAM; though weaker for surface NAM.

          Our results suggest that solar variability, modulated by the phase of QBO, influences zonal mean temperatures at high latitudes in the lower stratosphere and subsequently affect sea level pressure near the poles. Thus a knowledge of the state of the Sun, and the phase of the QBO might be useful in surface climate prediction.
          http://www.atmos-chem-phys.net/11/11679/2011/acp-11-11679-2011.pdf

          There are also links in the changes in ozone and changes in the winds that drive the Antarctic Circumpolar Current. Changes in that current coupled with the constrictions at the tip of South American and Africa affect the Pacific and Atlantic. (The infamous teleconnection perhaps?)

          Some other interesting tidbits:

          Kirkland, Matt W.; Tinsley, Brian A.; Hoeksema, J. Todd
          Journal of Geophysical Research, Volume 101, Issue D23, p. 29689-29700, 1996.
          DOI: 10.1029/96JD01554

          Abstract
          Evidence has accumulated for the past two decades demonstrating a correlation between Earth transits of the heliospheric current sheet (HCS) and changes in winter tropospheric vorticity. These correlations persisted for a few years following the Agung and El Chichón volcanic eruptions, but were significantly weaker at other times. This suggests that the missing link in a physical mechanism explaining the correlation may involve volcanic aerosols and their effect on cloud microphysics, via atmospheric electricity. An analysis of 500-mbar northern hemispheric vorticity for the 1991-1994 winter periods following the Pinatubo eruption shows a similar correlation between tropospheric vorticity and Earth transits of the HCS, supporting the previous interpretation.

          Atmospheric Dynamical Responses to Solar Wind Variations on the Day-to-Day Timescale.
          Tinsley, B. A. [Tinsley@UTDallas.edu]
          American Geophysical Union, Fall Meeting 2001, abstract #A11A-0031, 2001

          Abstract
          In the early 1970s it was shown by John Wilcox and associates and verified by Colin Hines that the strength of winter storms across the northern hemisphere decreases at times of solar wind ‘sector boundary’ crossings. These are now known as heliospheric current sheet (HCS) crossings, and correspond to the extension of the coronal streamer belt passing over the Earth, with reductions in solar wind velocity by about 10%. The strength of winter storms is objectively evaluated by the vorticity area index (VAI) calculated from gridded geopotential height data sets. It was shown by Tinsley, Hoeksema, Baker and Kirkland in the mid-1990s that this VAI response (the Wilcox effect) tracks the decrease in MeV electron flux precipitating from the magnetosphere, with a lag of less than a day. The MeV electron flux is strongly correlated with solar wind velocity, and together with its associated X-ray Bremsstrahlung modulates the stratospheric vertical column resistance. For winters when the column resistance is unusually high because of a high mixing ratio of H2SO4 from volcanic eruptions, the ionosphere-earth current density Jz is modulated by these stratospheric resistance variations. The winter storm response can be understood in terms of a general theory (Tinsley, Space Sci. Rev., 94, 231-258, 2000), and it involves changes in cloud microphysics and precipitation from the storm systems at mid-high geomagnetic latitudes, due to electroscavenging by cloud droplets. The electroscavenging rate tracks the Jz changes. There is a similar effect from reductions in tropospheric resistance associated with changes in cosmic ray flux during magnetic storms, first noticed in
          the 1960s by Walter Orr Roberts and associates. The Roberts and Wilcox effects are part of a more general influence of solar activity affecting Jz and clouds, which is part of an even more general influence of electroscavenging on clouds. The precipitation changes associated with cosmic ray and Jz changes have been evaluated by Kniveton and Todd (GRL 28, 1527-1530 and 3279). In winter storms the VAI response arises from a redistribution of vorticity within the storm because of diabatic heating changes. The storm vorticity changes have longer term dynamical and climatic consequences.

          Too bad all the time and money is wasted on beating the CO2 dead horse.

  7. The latest from our dear friends at the NOAA regarding Arctic sea ice:

    http://www.esrl.noaa.gov/psd/news/2014/122214.html

  8. Robert Balic says:

    Just looked at an old Britannica atlas printed in 1980.
    http://s5.postimg.org/9lfzx0e7b/brit_atlas.jpg

    The graphic of the Arctic ice is interesting. It doesn’t state what season the map represents but I compared it with the September mean for 1979-2000. The Brit atlas has the Queen Elizabeth Islands ice free while the Sep mean doesn’t. The same with Victoria Island. The areas that seem to represent surfaces that are much less than 100% ice extend to the Alaska in the Beaufort sea but not near the Russian coast at all. The East Siberian Sea and Bolshevik Island are ice free in the Brit Atlas.

    We also have the ice something like 1000 km from Alexandra Strait but apparently the Russian ship sailing there is a sign that the Arctic could be ice free in just 6 years.
    http://www.thestar.com/news/canada/2014/12/22/icefree_arctic_could_be_just_six_years_away.html

    Its clear that the average minimum sea ice extent for 1979-2000 was much larger than in the 70s.

Leave a Reply

Your email address will not be published. Required fields are marked *