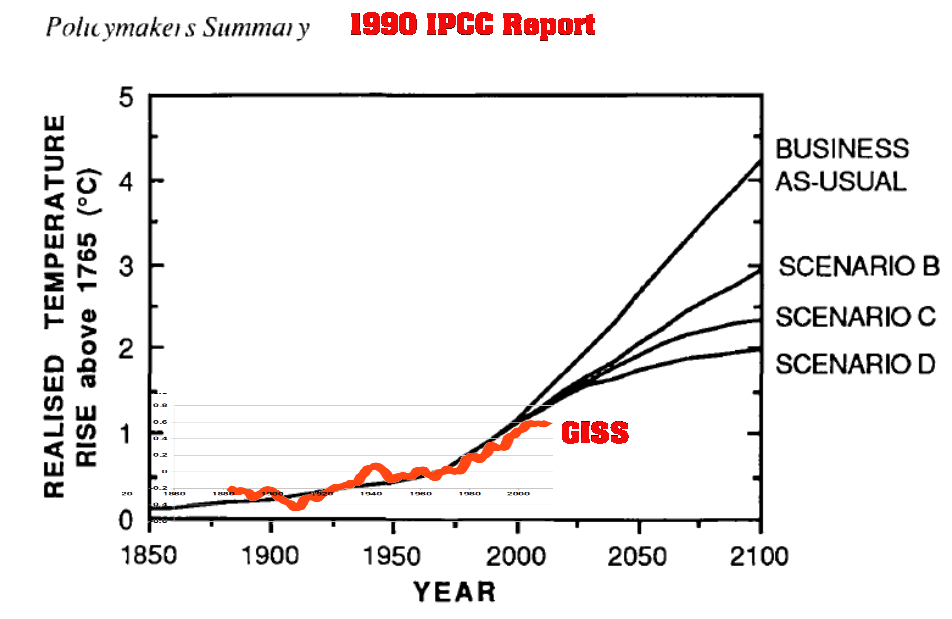
Even with Gavin’s best cheating, temperatures are far below 1990 IPCC scenario D
Disrupting the Borg is expensive and time consuming!
Google Search
-
Recent Posts
- Gaslighting 1924
- “Why Do You Resist?”
- Climate Attribution Model
- Fact Checking NASA
- Fact Checking Grok
- Fact Checking The New York Times
- New Visitech Features
- Ice-Free Arctic By 2014
- Debt-Free US Treasury Forecast
- Analyzing Big City Crime (Part 2)
- Analyzing Big City Crime
- UK Migration Caused By Global Warming
- Climate Attribution In Greece
- “Brown: ’50 days to save world'”
- The Catastrophic Influence of Bovine Methane Emissions on Extraterrestrial Climate Patterns
- Posting On X
- Seventeen Years Of Fun
- The Importance Of Good Tools
- Temperature Shifts At Blue Hill, MA
- CO2²
- Time Of Observation Bias
- Climate Scamming For Profit
- Climate Scamming For Profit
- Back To The Future
- “records going back to 1961”
Recent Comments
- Bob G on Gaslighting 1924
- John Francis on “Why Do You Resist?”
- conrad ziefle on Gaslighting 1924
- Bob G on Gaslighting 1924
- Bob G on Gaslighting 1924
- Bob G on Gaslighting 1924
- conrad ziefle on Gaslighting 1924
- Bob G on Gaslighting 1924
- Bob G on Gaslighting 1924
- arn on Gaslighting 1924


https://www.youtube.com/watch?v=-hF3Q6op0e4
It should also be noted that CO2 emissions have been far higher than the BAU scenario presented in the 1990 IPCC report. For example, it was assumed we wouldn’t reach 10GtCO2/yr until 2020-2025 from a 1.5-2ppm/yr growth rate. We hit that mark this year and CO2 accumulation in the atmosphere has been roughly 2.5ppm/yr.
So reality of emissions is WORSE than the BAU scenario but reality of temperatures is LESS than the 100% phase out of carbon by 2000.
Taking the numbers of the graph and the GISS ‘adjusted’ data the earth is still ~0.6 degrees cooler than predicted for business as usual.
Consider the building of Coal plants in India, China and other third world countries has greatly expanded thanks to the World Bank (20% US tax payer financed) lending programs the CO2 output should be higher than ‘business as usual’
The World Bank released a very inflammatory document screaming about the dangers of CAGW: The World Bank 4 degree report in full here and summary for policymakers here.
But was then caught with it’s pants down:
http://co2scorecard.org/Content/uploads/WB_Exhibit_1.jpg
Sorry as usual the damaging documents have been ‘disappeared’
WUWT has a discussion of the report:
When bankers turn climatologists
With bankers, all you have to do is follow the money! 🙂
They follow their own tails.
Wow, that’s interesting — it’s the same verbiage as Hansen’s 1988 presentation to Congress. More evidence (as if any was needed) that modellers used Scenario A as a prediction for what would happen if emissions rose exactly the way they actually did.
Gavin needs to get to work, pronto!
Is that orange squiggle line supposed to be a temperature record? or an ‘anomaly’ of a temperature record? serious question.
It is GISS so it is a messaged, mutilated and adjusted ‘anomaly’ of the temperature record after all the rural stations have been deleted.
Even with all their contortions they still could not get an ‘anomaly’ of the temperature record to agree with their predictions.
That is why they booted Hansen and brought in a mathematician (Gavin Schmidt) to wrestle the data into compliance. So far he has managed to get 2014 to be the WARMEST YEAR EVAHHhhh. Mean while Hansen is free for lectures and protests.
Actually, he’s anything but free…I heard he’s a rather costly to bring in for a lecture.
It obviously must be a tortured piece of data. unbelievable!