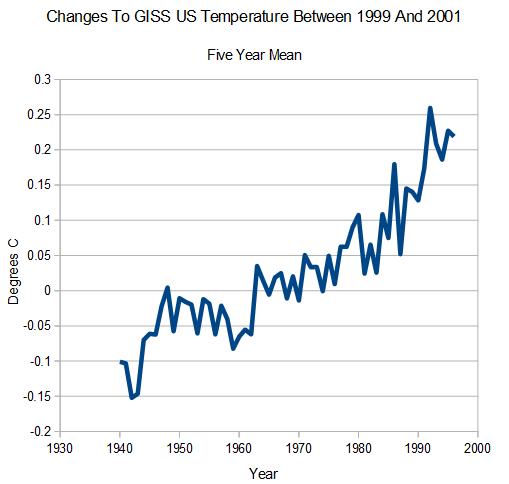
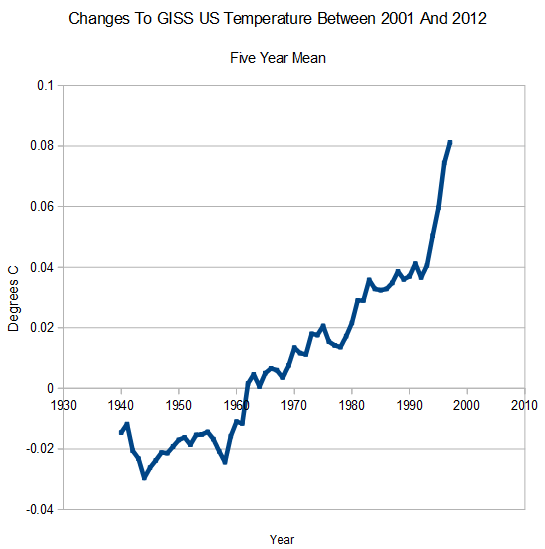
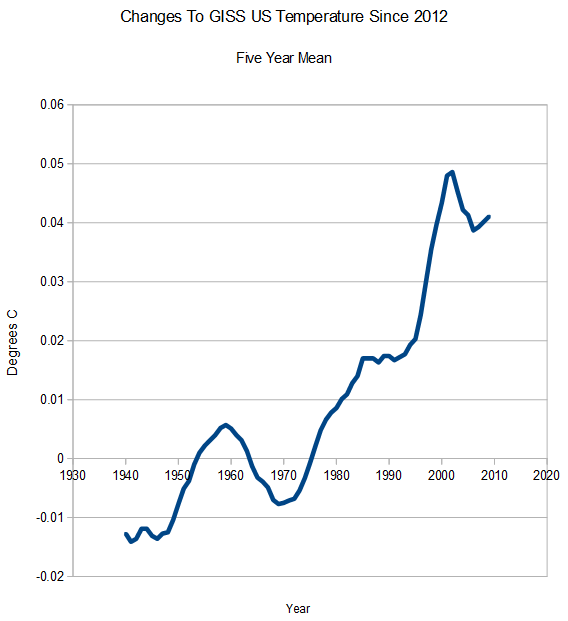
The US is not warming, so Tom Karl and Gavin Schmidt have to keep cooling the past and warming the present to make it appear to be warming. The graphs below show changes to their own data from 1999 to 2001, 2001 to 2012, and from 2012 to 2014. Note how they repeat the same hockey stick of data tampering in order to create the appearance of a non-existent warming.
Also note how they overwrite their data in place, in order to hide their constant data tampering.
current version: data.giss.nasa.gov/gistemp/graphs_v3/Fig.D.txt
2012 version: web.archive.org/…data.giss.nasa.gov/gistemp/graphs_v3/Fig.D.txt
2001 version: wayback.archive.org/…/www.giss.nasa.gov/data/update/gistemp/graphs/FigD.txt
1999 version: pubs.giss.nasa.gov/docs/1999/1999_Hansen_etal_1.pdf


Just asking but is this possible, is this normal snow extent cover for NH at this time of year?
http://arctic.atmos.uiuc.edu/cryosphere/NEWIMAGES/arctic.seaice.color.000.png
The albedo effect must be kicking in with this extensive cover (assuming its way over normal)
Largest on record
http://climate.rutgers.edu/snowcover/images/nhland_season4.png
Fast Draw..lol
ALl we get is rain (even last winter, we were the green spot amid the snow). TOBL
All Time Record Fall Snow Cover Extent
http://climate.rutgers.edu/snowcover/images/nhland_season4.png
Its only showing the snow cover here (although it did appear on the single image but disappeared when posted here..interesting)
http://arctic.atmos.uiuc.edu/cryosphere/
Also it is obvious the whole AGW ice melting scam has completely failed. Why doesn’t CT remove its ridiculous ice melting due to AGW agendas (ie movie of dramaticice melt 2007) they just look really stupid and unprofessional now.
http://arctic.atmos.uiuc.edu/cryosphere/IMAGES/global.daily.ice.area.withtrend.jpg
Tale of the tape my foot!
And from Gavin and Tom there comes….not a peep.
“The algorithm is working as designed.”
Isn’t that the AlGore-ithm?
Are these adjustments cumulative? I believe they are but just asking to be certain.
i.e., current total adjustment is summation of three adjustments shown.
No, there were additional adjustments prior to 1999
sent to me, mate,… you gotta stop liking the propaganda peddled by your AGW friends. I just graphed up the data that StevenGoddard just slanderised, and the only person guilty of tampering is him. But then again, it probably keeps his bank balance healthy.