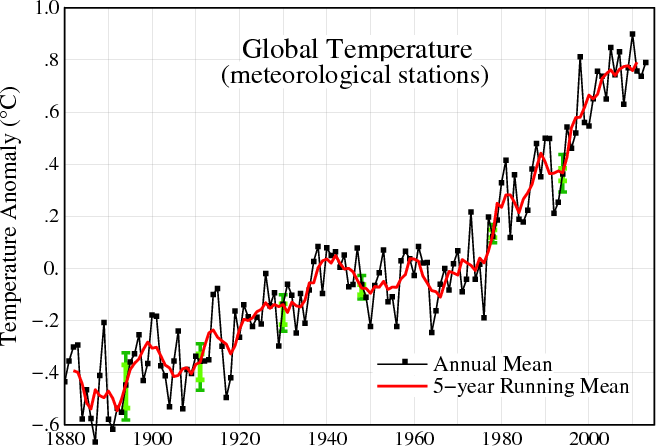
2014 version
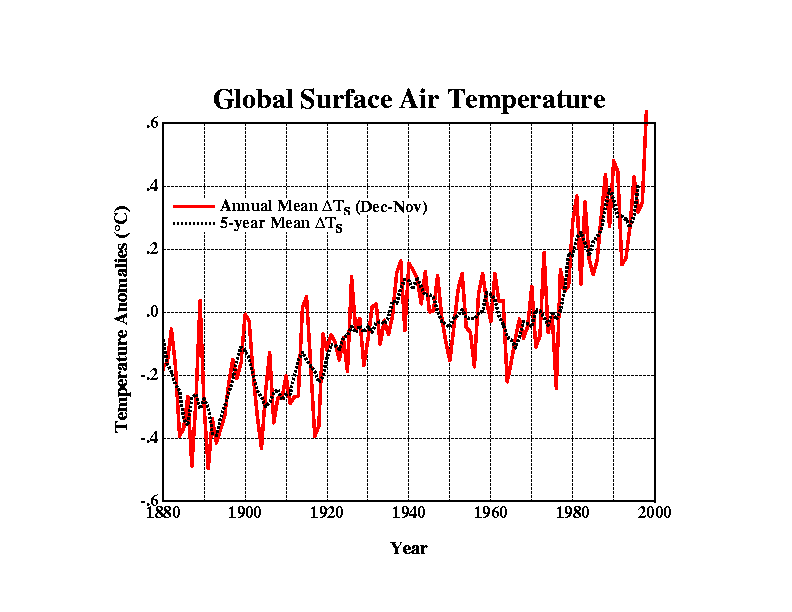
1999 version
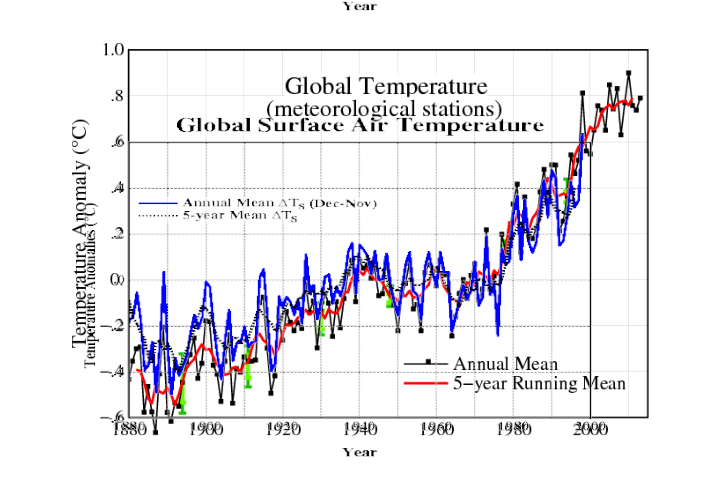
 If we overlay the two graphs normalized to 0 anomaly (with 1999 in blue) they appear to be fairly similar.
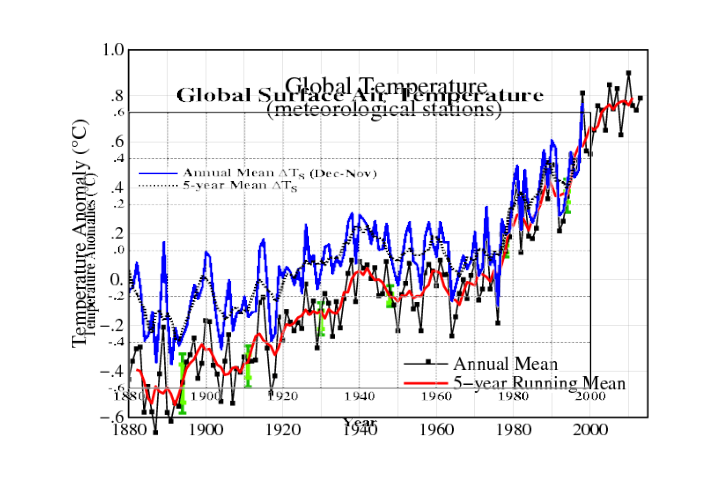
 But Gavin did a trick. He cooled the baseline temperatures, so that half of the tampering is cooling before 1970, and half is warming after 1970.
The next graph normalizes the two data sets to the years 1995-1997, so we see the full magnitude of the tampering since 1999. Now it becomes clear that Gavin has cooled the past about 0.3C, in addition to all of the data tampering which was already being done in 1999.


Bang to rights!
Bang on!
They might fud our rights but they’ll never conceal our data.
Great,Tony. You might want to delete the details.Ta.
I can’t believe Gavin, the MET Office, NASA, NOAA, the IPCC and all these Governmental Agencies are allowed to get away with this…. Seriously…
This is FRAUD, not Science..
Steven Is the following a recent example of a baseline shift like you mention or something else altogether?
In the linked 2011 WUWT post there was a NCDC graph of average temps from 1895 – 2010. The base years appear to be average annual 1901 – 2000. The average annual temperature for the period 1901 – 2000 = 52.79 degrees F.
OK Today if I go to NCDC web site and try reproduce that graph 1895 – 2010 with a 1901- 2000 base line it shows a 1901 – 2000 temp average annual of 52.02 degrees F.
http://wattsupwiththat.com/2011/11/05/ncdc-data-shows-that-the-contiguous-usa-has-not-warmed-in-the-past-decade-summers-are-cooler-winters-are-getting-colder/
http://www.ncdc.noaa.gov/cag/time-series/us/110/00/tavg/ytd/12/1895-2010?base_prd=true&firstbaseyear=1901&lastbaseyear=2000&trend=true&trend_base=10&firsttrendyear=1895&lasttrendyear=2010
I notice most of the .3 degrees (.25 by eyeball) is done by 1950; the time frame from when human contributions of CO2 are said to begin to have their affect.
By 1999 they had already lowered the highs from the 1940s, which were not just in the US.
Yep.
Gavin, the American dream.
No wait, Bobby Brown is the American dream.
http://m.youtube.com/watch?v=iW4Bm7q_zOc
Somebody needs to file a FRAUD Lawsuit….
Using Gavin’s exact method, but opposite, would be a good way to prove a point to Him and other crazy Climate Change folks… take the same data, and manipulate it to “warming the past, while cooling the present”… I’d love to see that chart..