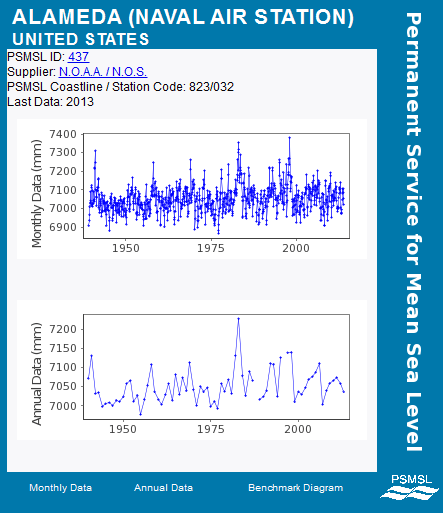
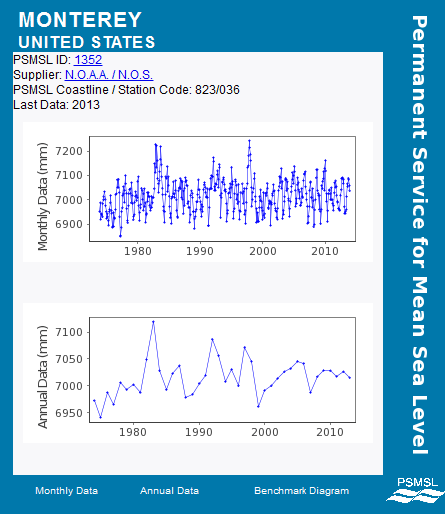
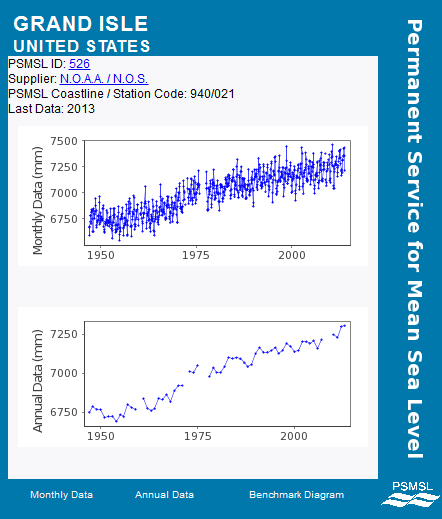
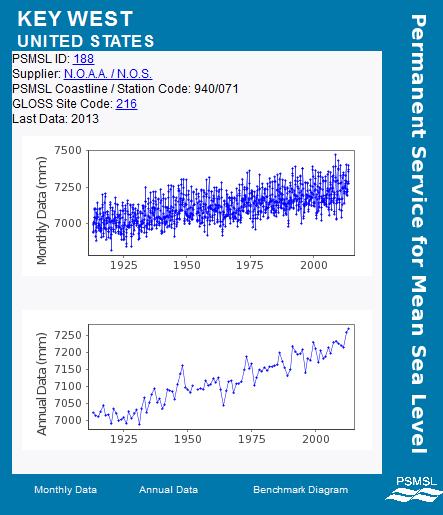
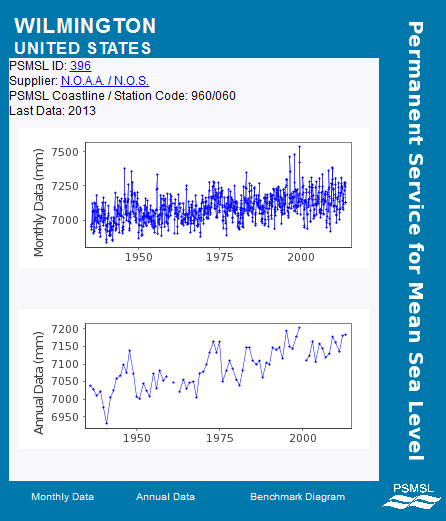
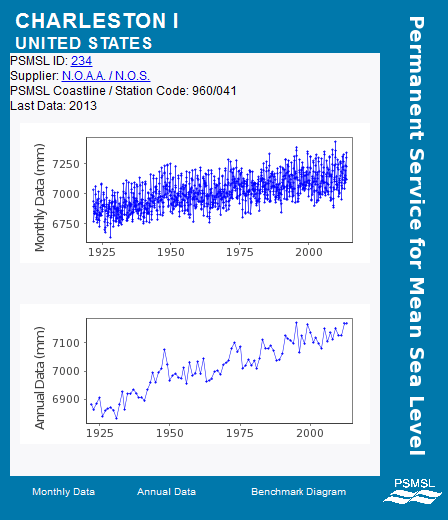
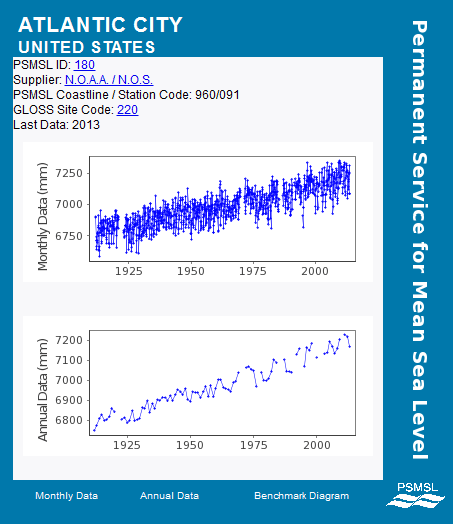
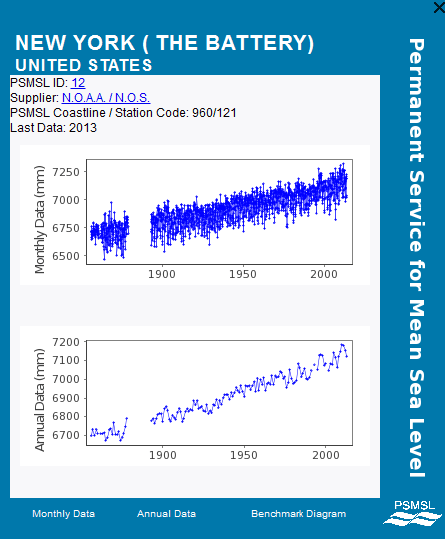
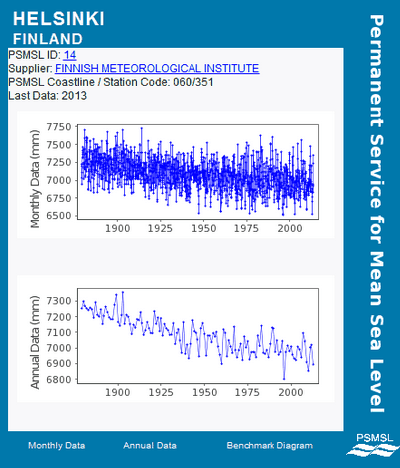
The IPCC and climate science in general is driven by junk science and spectacular fraud, but none are perhaps worse than their claim that sea level rise rates have doubled since 1993. There isn’t one shred of tide gauge evidence to back this claim up. The malfeasance is off-scale.
Disrupting the Borg is expensive and time consuming!
Google Search
-
Recent Posts
- Gaslighting 1924
- “Why Do You Resist?”
- Climate Attribution Model
- Fact Checking NASA
- Fact Checking Grok
- Fact Checking The New York Times
- New Visitech Features
- Ice-Free Arctic By 2014
- Debt-Free US Treasury Forecast
- Analyzing Big City Crime (Part 2)
- Analyzing Big City Crime
- UK Migration Caused By Global Warming
- Climate Attribution In Greece
- “Brown: ’50 days to save world'”
- The Catastrophic Influence of Bovine Methane Emissions on Extraterrestrial Climate Patterns
- Posting On X
- Seventeen Years Of Fun
- The Importance Of Good Tools
- Temperature Shifts At Blue Hill, MA
- CO2²
- Time Of Observation Bias
- Climate Scamming For Profit
- Climate Scamming For Profit
- Back To The Future
- “records going back to 1961”
Recent Comments
- Bob G on Gaslighting 1924
- John Francis on “Why Do You Resist?”
- conrad ziefle on Gaslighting 1924
- Bob G on Gaslighting 1924
- Bob G on Gaslighting 1924
- Bob G on Gaslighting 1924
- conrad ziefle on Gaslighting 1924
- Bob G on Gaslighting 1924
- Bob G on Gaslighting 1924
- arn on Gaslighting 1924


The Most Blatant Fraud Of All?
Construction of a worldwide Matrix of Deceit after frightened world leaders:
1. Formed the United Nations to end the sovereignty of national governments on 24 Oct 1945
2. Forbid knowledge of the force that created the world and destroyed Hiroshima on 6 Aug 1945
However, while standing in the ruins of Hiroshima, the late Professor Paul Kazuo Kuroda had already realized in Aug 1945 that the nuclear force [1] that powers atomic bombs and nuclear reactors is also the one that made the chemical elements and gave birth to the world (See past paragraph on page 2 of Kuroda’s book [1].)
1. P. K. Kuroda, The Origin of the Chemical Elements and the Oklo Phenomenon (Springer-Verlag, Berlin, 1982, 165 pages)
http://www.amazon.com/Origin-Chemical-Elements-Oklo-Phenomenon/dp/3540116796
Today is the 73rd anniversary of the attack on Pearl Harbor.
Here is the draft abstract for a paper I plan to present next year:
https://dl.dropboxusercontent.com/u/10640850/The_Begining_of_the_World.pdf
Comments, criticisms and corrections are welcome.
There’s a very thorough Israeli study of tide gauges out there….65% showed no sea level rise or showed sea levels falling
It’s the same strategy with ocean acidification.
Create fear then offer a solution.
It’s a transparent manipulation to those willing to do some research. Sadly many people just accept the propaganda as fact, not bothering to ask questions.
Oh good, I get to post this one twice today:
If you go to the Internet Archive’s WayBack Machine:
http://archive.org/web/web.php
and plug in the URL for Colorado Universty’s Sea Level Research Group
http://sealevel.colorado.edu/
You will find records that go back to 2004. The earliest functional “mean sea level time series” link is from March 27th of that year, and if you follow that link through to “Inverted Barometer Applied” and “Seasonal Signals Removed” and click on text
http://web.archive.org/web/20040413231515/http://sealevel.colorado.edu/2004_rel1.2/sl_ib_ns_cu2004_rel1.2_global.txt
you will find the data as it existed for 1992.928 thru 2003.842 It’s then rather simple to download the series into Excel and find the slope. It comes out to be 2.6 mm/yr. If you then go to Colorado University’s Sea Level Research Unit today and dowload the “Raw data (ASCII)”
http://sealevel.colorado.edu/files/2013_rel4/sl_ns_global.txt
You will find that the same series for 1992.96 through 2003.846 comes out to be 3.5 mm/yr.
Somehow over the last ten years the data has been changed. What had been 2.6 mm/yr in 2003 is now 3.5 mm/yr. An increase of 0.9 mm/yr.
If you ask Colorado University about these changes they say:
“The sea level time series release from 2004 is over eight years old, and in that time many parts of the TOPEX and Jason-1 processing have been updated to reflect instrument and ancillary data improvements. Without recreating each processing change over the last eight years, We cannot point to any specific update that is the main cause of the differences between the 2004 and the current release. But a partial list of the more influential updates include:
– updated orbits
– updated radiometer corrections
– updated tide models
– updated sea state bias models
– updated dynamic atmosphere
“A review of the release notes shows how we continually apply what the altimeter science community considers to be the most up-to-date set of processing parameters.”
It all boils down to the obvious conclusion that the historical data has been rewritten.
In other words…even though the data is historic fact, we have to adjust it to match our preconceived notion of what it should say…not what it does say. Ignore the man behind the curtain.
You’re missing the point. You can’t trust tide gages; they only measure sea level where the ocean hits the land. What about all those mountains of water out in the middle of the oceans that only the satellite measurements can reveal?
(/sarc if needed)
2×0=0 The current rate of sea level rise is 2x what it was only 10 years ago. That is so obvious.
The best tide gauge in the world dates back to 1168 AD – Itsukushima Shrine on the Japanese Island of the same name. Although the shrine appears to be floating at high tide, it is fixed by pier-like structures. The elevation has remained unchanged for approximately 850 years. So much for catastrophic rising sea levels.
http://farm3.staticflickr.com/2476/4102396416_3ebfc5456e_z.jpg
Reblogged this on Centinel2012 and commented:
With progressives facts don’t matter — all that counts is the claim!
That is why their smear campaigns always work so well. They come out of nowhere and leave the victim open mouthed wondering what in heck hit him.