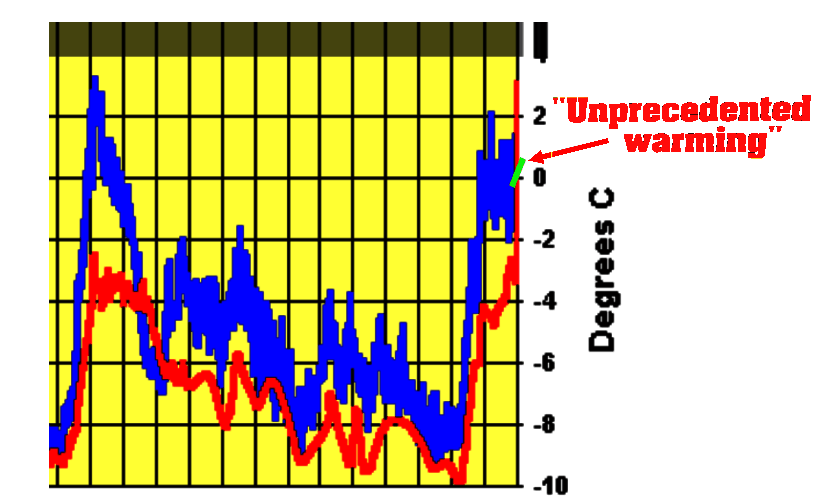
According to fake temperatures from NASA, the Earth has warmed an unprecedented 0.7C this past century, shown in green below.

Actual scientists would describe this as noise, but that isn’t who we are dealing with.
According to fake temperatures from NASA, the Earth has warmed an unprecedented 0.7C this past century, shown in green below.

Actual scientists would describe this as noise, but that isn’t who we are dealing with.
Using HADCRUT4, I would use from 2001. There is a slight decline from that year as well. The reason for this is that the period 1974-2001 is the longest period since 1850 when the warming can be accounted for by CO2 alone if you assume a doubling of CO2 levels will lead to 3 degrees of warming. To be specific Mauna Loa levels increased from 329.7 to 371.3, predicting a 0.51 C rise, the same as the rise using least squares. It is probably the the only period in over 400,000 years that can be accounted for by CO2.
From 2001 to 2013, CO2 levels increased from 371.3 to 396.5, giving a predicted rise of 0.28 Celsius. HADCRUT4 shows a fall of -0.01 degrees of warming. We have a 0.3 C deficit in warming since 2001 – more if you use the satellite record or add in other GHGs.
Really? The period 1974 to 2001 can be accounted for by CO2 alone? This graph shows that it can be accounted for by irradiance alone. Just look at all these watts:
http://www.hyzercreek.com/sun.jpg
The period ~1970-2000 is effectively identical in both slope and duration to the period ~1910-1940, the date at which most climate McScientists assert anthropogenic warming to have commenced, despite there being a pronounced cooling phase ~1941-1970.
http://www.woodfortrees.org/plot/hadcrut4gl/from:1850/trend/plot/hadcrut4gl/from:1910/to:1940/trend/plot/hadcrut4gl/from:2001/trend/offset:-0.1/plot/hadcrut4gl/from:1860/to:1880/trend/plot/hadcrut4gl/from:1970/to:2000/trend/plot/hadcrut4gl/from:1881/to:1910/trend/plot/hadcrut4gl/from:1941/to:1970/trend/plot/hadcrut4gl/from:1850/to:1860/trend/plot/hadcrut4gl/mean:120
There is a clear ~60 year cycle evident which appears to correlate with the NAO, superimposed on a ~0.50°C per century increase as the Earth exist the LIA.
There is no evident anthropogenic CO2 warming whatsoever.
There is a slight problem with using the Climastrologist ‘Adjusted’ Data for that type of analysis:
https://stevengoddard.files.wordpress.com/2014/08/screenhunter_1618-aug-03-09-45.gif
That is for the USHCN (U.S. Historic Climate Network) supposedly the best data available.
From: https://stevengoddard.wordpress.com/2014/08/02/proof-that-us-warming-is-mann-made/
You might want to verify that and/or try it on some other Climastrologist ‘Adjusted’ Data.
My comment was in response to manicbeancounter says on December 21, 2014 at 1:31 pm
I can’t accept that. The latest study I’ve seen for that period have the rates of temperature change almost completely correlated with the increase in the use of radial tires on passenger cars. The correlation becomes almost perfect when we add the well known forcings from decreasing the number of coin operated telephones in the latter part of the period. (Do I need to add the </sarc> tag?)
CO2 doesn’t control anything but the number of bubbles in my Dr. Pepper… oh, and it keeps all plants alive and gives them the raw material to make the O2 and food that keeps all animals alive.
You left out the additional amount of gases from the immolation of the chicken innards after the hepatomantic ritual.
I’d like to know what actual attorneys and actual jurors call it.
Reblogged this on Centinel2012 and commented:
Political noise trumps science every time!
Describing the variations in the graph as noise is particularly apt. The variations are less than the usual error in reading the thermometer and they are certainly less than the ‘adjustments’ that are regularly applied by the Warmista Climatologist record keepers.